


Summary
- Like shares, ETFs also trade on stock exchanges and provide investors with access to different markets across the globe.
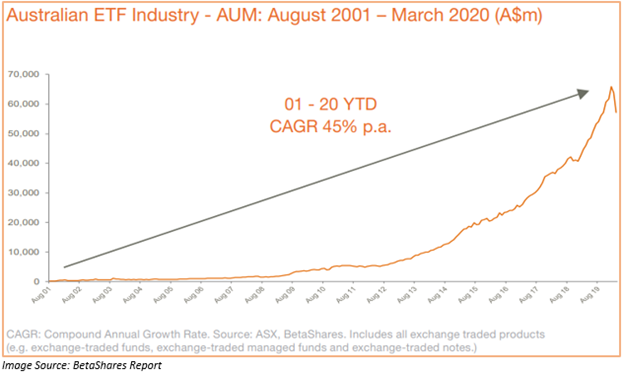
- In Australia, ETF trading has risen significantly at a CAGR of 45% p.a. over the last ten years.
- BetaShares Nasdaq 100 ETF provides an investor with access to top 100 of the largest non-financial businesses listed on the NASDAQ market.
- BetaShares Asia Technology Tigers ETF gives access to leading technology companies from Asia apart from Japan.
An ETF, or exchange-traded fund, trades on stock exchanges just like any normal share and is amongst the fastest-growing categories of investment products in the world. An ETF provides an investor with access to almost every corner of the market. The funds track the performance of a given index or an asset class and deliver a return on that index or asset class less the fees. They provide admission to a range of bonds, shares (domestic and international both), or other asset types such as commodities, listed property, and currencies.
When we talk about the growth of ETFs, it is the fastest-growing investment product. As of March 2020, the global ETF industry had ~US$5.3 trillion in AUM.
INTERESTING READ: 6 Reasons to look at ETFs
In Australia, the investor’s appetite for ETFs has shown a dramatic improvement in the last ten years. From August 2001 till March 2020, the CAGR of the Australian ETF industry has grown up by 45% p.a.
RELATED: Looking to invest in ETFs? 5 Tips for ETF investors
In this backdrop, let us look at a few ASX-listed ETFs and understand the vital features of these funds.
BetaShares Nasdaq 100 ETF (ASX:NDQ)
BetaShares Nasdaq 100 ETF tracks the performance of the NASDAQ 100 index. The ETF aims to provide investment return before fees and expenses.
NASDAQ-100 comprises of 100 of the largest non-financial businesses listed on the NASDAQ market, including companies that are the face of the new economy.
Essential features of the index:
- The fund provides access to big players listed on NASDAQ like Apple, Google, and Amazon.
- As the index focuses more on the technology stocks, it offers exposure to a high-growth potential sector that is under-represented in the Australian share market.
- Management fees are just 0.48% per annum, and there is no need to complete any W-8 BEN forms.
A Glance at the Sector Allocation of the Index:
As at 31 May 2020, the major portion of the index includes IT sector (47%), Communication Services (20.8%), Consumer Discretionary (16.4%), Healthcare (7.7%), Consumer Staples (5.2%), industrial 2.2% and Utilities 0.7%.
Fund Performance:
In the last five years, the fund has provided a return of ~145.52%. The YTD performance of the fund is 17.38%. By the end of day’s trade NDQ unit, closed at A$24.920, up 0.809% from the previous close and has reached near its 52-week high price.
ETFS Morningstar Global Technology ETF (ASX:TECH)
ETFS Morningstar Global Technology ETF invests in global technology companies that include hardware, software, and IT services. The fund aims to offer investors with a return that tracks the performance of the Morningstar Developed Markets Technology Moat Focus Index.
The index comprises of 25 to 50 global technology companies engaged in software, semi-conductor, data processing, computer equipment and databases.
Advantage of Considering Tech:
- Simple and low-cost sector access to global technology.
- Diversification through investment in a sector that is highly understated in the Australian domestic market.
- Investor gain access to stock selection powered by Morningstar’s proprietary research.
- Liquid & crystal clear.
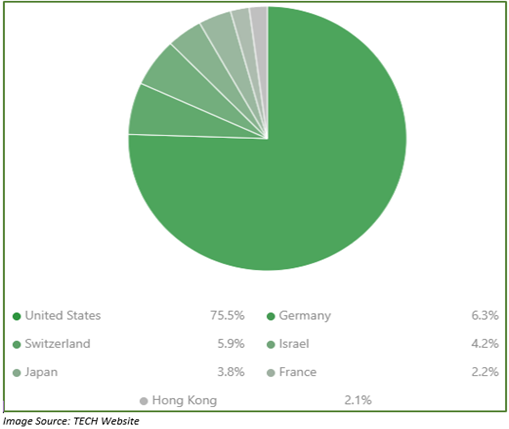
Sector Distribution:
The index focusses 100% on the technology sector. 75.5% of the stocks are from the US, 6.3% from Germany, 5.9% from Switzerland, 4.2% from Israel, 3.8% from Japan, 2.1% from Hong Kong and remaining 2.2% from France.
The inception date of the index was 7 April 2017, and it provides dividend semi-annually. The index is domiciled in Australia and has a management cost of 0.45% per annum.
TECH Performance:
TECH unit, since inception, delivered a return of 77.69%. In the last 12 months, it has provided a return of 17.68%. By the market closure on 26 June 2020, TECH unit was up by 1.447% settling at A$89.060. The fund was closer to its 52-week high of A$89.200.
Vaneck Vectors Australian Banks ETF (ASX:MVB)
Vectors Australian Banks ETF invests in a diversified portfolio of ASX-listed securities. The index aims at providing the investors with an investment return that carefully track the performance of the MVIS Australia Banks Index.
The index comprises the largest & most liquid ASX-listed businesses that yield a minimum of 50% of their revenues or assets from the Australian banking sector.
The index provides dividend semi-annually. It has a management cost of only 0.28% per annum. The inception date of the index is 14 October 2013.
Top Holdings of the Index:
- Commonwealth Bank of Australia: 20.61%
- National Australia Bank Ltd: 94%
- Australia & New Zealand Banking Group Ltd: 19.85%
- Westpac Banking Corporation: 19.60%
- Macquarie Group Ltd: 17.15%
- Bendigo & Adelaide Bank Ltd: 1.56%
- Bank of Queensland Ltd: 1.28%
A Peek into MVB’s Fundamentals:
- Price/Earnings Ratio: 12.56
- Price/Book Ratio: 1.05
- Dividend Yield: 6.04%
- Weighted Avg. Market Cap (M): A$62550.00
MVB Performance:
Since its inception, MVB has delivered a negative return of 17.95%. The performance remains negative in five years and last year. However, it has delivered a return of 18.50% in the previous three months.
By the end of day’s trade on 26 June 2020, MVB unit improved by 1.072% from the previous close and stood at A$20.750.
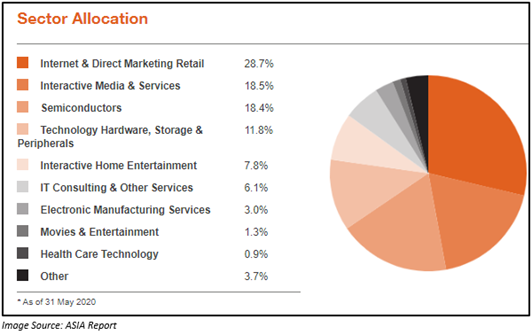
BetaShares Asia Technology Tigers ETF (ASX:ASIA)
BetaShares Asia Technology Tigers ETF track the performance of an index that includes the 50 largest technology and online retail stocks in Asia, excluding Japan. The index consists of technology giants such as Alibaba, Tencent, Baidu and JD.com.
Benefits of the Fund:
- An investor can gain access to leading technology companies from Asia apart from Japan. They would get exposure to ‘technology tigers’ top Asia’s technological revolution.
- Enormous growth opportunity.
- Provides global diversification: In one trade, the index offers a diversified introduction to a high-growth sector that is under-represented in the Australian share market.
Points to know about ASIA:
- Provides distribution annually.
- Charges management fees of 0.57% per annum
- Expenses are around 0.10% per annum.
Sector Distribution:
Some of the top companies in the index are:
- Alibaba Group Holdings Limited: 9.2%
- Tencent Holdings Limited: 9.1%
- Taiwan Semiconductor: 9.1%
- Samsung Electronics: 8.9%
- Meituan Dianping: 8.4%
- com Inc: 6%
- NetEase Inc: 4.7%
- Pinduoduo Inc: 4.1%
- Infosys Ltd: 3.7%
- SK Hynix Inc.: 3.7%
ASIA Performance:
ASIA got officially listed on 21 September 2018. Since its inception, ASIA delivered a return of 41.86%. In the last 12 months, it has provided a return of 48.89%.
By the market closure on 26 June, ASIA unit closed 0.461% above its previous close and stood at A$8.710. ASIA unit was close to its 52-week high of A$8.710.
