


The S&P/ASX 200 Index was trading higher at 6,762.6, up 0.47%, adding 31.8 basis points, while S&P/ASX 200 Health Care Index was also trading higher by 0.69% to 35,998.8, along with a 0.24% uptick in S&P/ASX 200 Information Technology Index to 1,392.4 on 23 September 2019 (AEST 11:52 AM). Letâs look at following five quality stocks that the investors have been eying on.
CSL Limited
CSL Limited (ASX: CSL), established in 1916 and headquartered in Parkville, Australia, is engaged in the research, development, manufacturing, commercialisation and distribution of innovative biopharmaceutical products in Australia as well as internationally in the United States, China, Switzerland, Germany, the UK, and other regions. The company operates via two primary business units - CSL Behring and Seqirus.
FY19 Resultsâ On 6 September 2019, CSL disclosed its Annual Report 2018/19, posting a net profit after tax of USD 1,919 million, up 17% on a constant currency basis and an 11% increase in revenue. The company also declared a final dividend of USD 1.00 per share (Record Date: 11 September 2019; Payment Date: 11 October 2019), concerning the six monthsâ period to 30 June 2019, taking the total full year dividend per share to USD 1.85.
 Source: CSLâs Annual Report 2018-19
Stock Performance - CSLâs market capitalisation stands at around AUD 106.43 billion with approximately 453.85 million shares outstanding. On 23 September 2019 (AEST 12:03 PM), the CSL stock was trading at AUD 236.740, up 0.955% by AUD 2.240 with ~ 124,653 million shares traded. In addition, the CSL stock has delivered positive returns of 26.50% YTD, 20.60% in the last six months, and 6.85% in the last three months.
Recently, one of the companyâs directors, Mr Paul Perreault disposed 5,350 ordinary shares (direct interest) in CSL.
Afterpay Touch Group Limited
IT player, Afterpay Touch Group Limited (ASX: APT) is a leading technology-driven payments services provider, offering two key products being Afterpay (buy now, pay later) and Pay Now (Touch) to customers, globally.
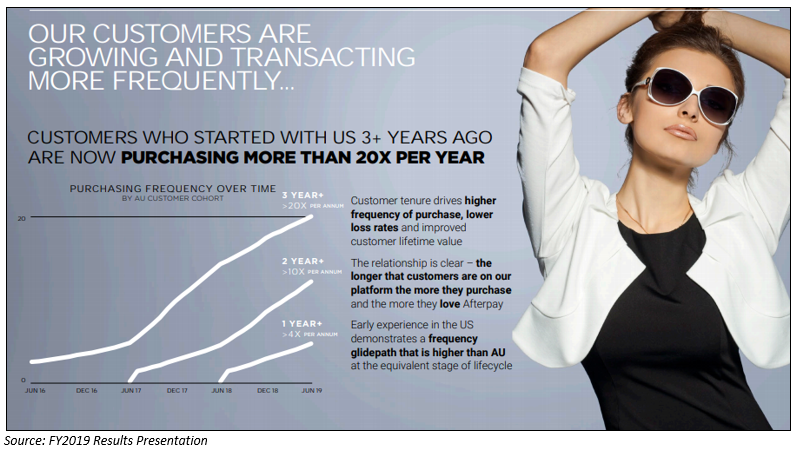
FY19 Results- Afterpay Touch Group disclosed its outstanding financial results for the 12 months to 30 June 2019 on 28 August 2019, reporting a stellar rise of 140% in global underlying sales to AUD 5.2 billion with a run-rate in excess of AUD 7.2 billion.
The total pro-forma income of Afterpay for the period amounted to AUD 251.6 million, up 115% while the active customer number stood at 4.6 million as at 30 June 2019, up 130% on FY18 (in excess of 5.2 million as on the announcement date). Currently, APT is signing up more than 12,500 new customers per day onboard. The Group continues to expand its global voice with the UK and the US delivering impressive sales figures (US underlying sales: ~ AUD 1 billion for FY19, run-rate over AUD 1.7 billion).
In its FY19 results, the company also reported that customers who started with the company three years ago are now purchasing more frequently, ~ 20x per year.
Stock Performance- Afterpay Touch Group has a market cap of AUD 8.35 billion with ~ 252.64 million shares outstanding. The APT stock was trading at AUD 32.130 on 23 September 2019 (AEST 12:12 PM), down 2.784% by AUD 0.920 with ~ 933,007 million shares traded. In addition, the APT stock has delivered positive returns of 175.42% YTD, 59.20% in the last six months, and 40.70% in the last three months.
Nearmap Ltd
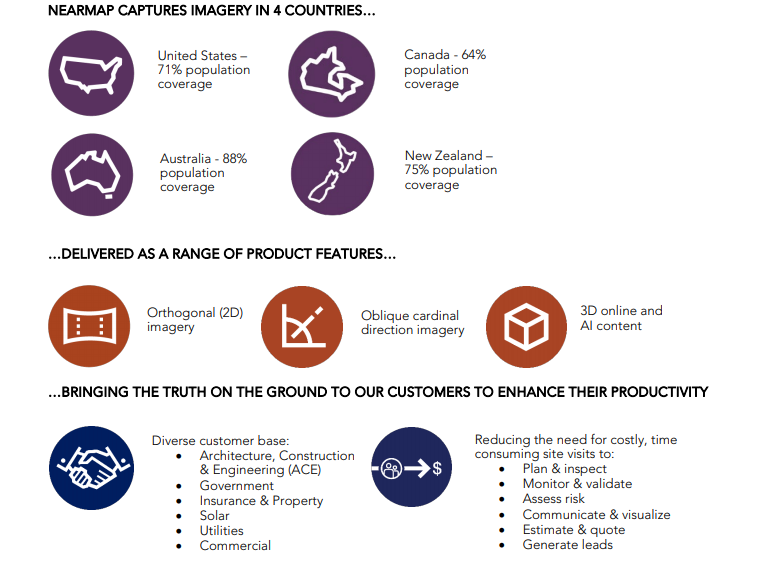
Nearmap Ltd (ASX: NEA), based in Barangaroo, Australia, is an information technology player engaged in the provision of online aerial photomapping services to clients in Australia as well as across the United States.
Source: FY19 Analyst Pack
New Directorâs Appointment â Recently on 27 August 2019, Nearmap announced to have appointed Tracey Horton AO to the Board of the company as an Independent Non-executive Director, effective 1 September 2019.
FY19 Results â The company reported a 36% (AUD 24.0 million) increase in its annualised contract value (ACV) to AUD 90.2 million for the year ended 30 June 2019. North America constitutes more than one third of its total portfolio. The statutory revenue for the period stood at AUD 77.6 million, up 45% on AUD 53.6 million recorded in FY18, while global subscriptions increased by 11% to 9,800, pushing the Group average revenue per subscription (ARPS), up 23% to AUD 9,208 as compared to AUD 7,473 in FY18.
The customer churn reduced to 5.3% while the Group sales team contribution ratio (STCR) remained strong at 106%, reflecting the higher investment during 2H19 in North American sales and marketing.
Stock Performance â With a market cap of AUD 1.2 billion and ~ 449.96 million shares outstanding, the NEA stock was trading at AUD 2.585 on 23 September 2019 (AEST 12:17 PM), down 3.184% by AUD 0.085. In addition, the NEA stock has delivered positive returns of 74.51% YTD.
REA Group Ltd
REA Group Ltd (ASX: REA) is a multinational digital advertising business that is primarily catering to the real estate sector. The Group operates leading residential, commercial and share property websites in Australia, as well as overseas in Asia (Malaysia, Hong Kong, Indonesia, China, Singapore, etc.).
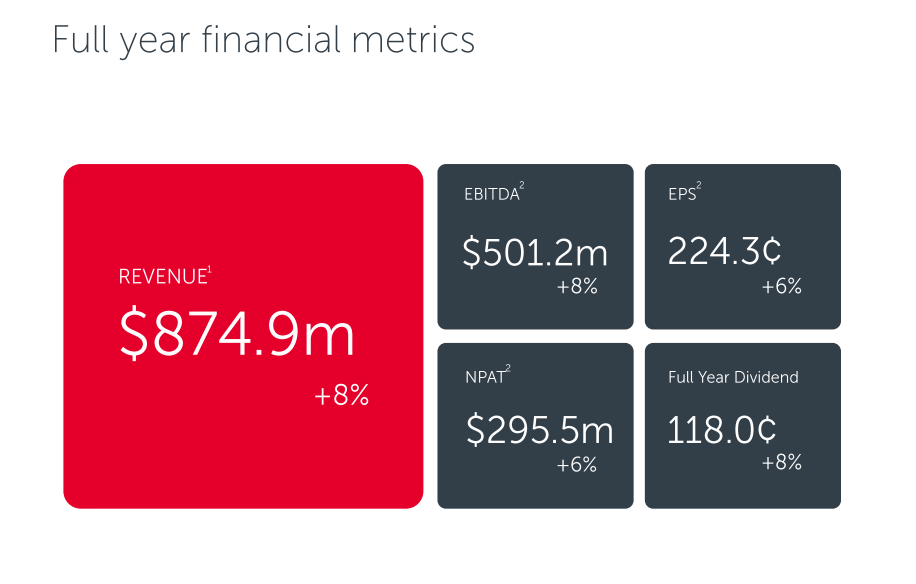
FY19 Results â The Group disclosed its financial results for the full year ended 30 June 2019 on 9 August 2019, posting revenue growth of 8% to AUD 874.9 million relative to FY18 and an increase of 8% in EBITDA to AUD 501.2 million. In addition, REA Group recorded a net profit after tax of AUD 105.3 million, down 58%.
The company attributed growth in revenue to an 8% increase achieved in Australia, owing to a strong performance of residential and developer businesses, amidst challenging market conditions, especially in 2H FY19. The Groupâs Board also declared a final fully franked dividend of AUD 0.63 per share, taking the total dividend to AUD 1.18 per share for FY19, also an 8% increase on FY18.
Source: REA Group Investor & Analyst Presentation
Stock Performance â REA Groupâs market cap stands at ~ AUD 14.23 billion with ~ 131.71 million shares outstanding. On 23 September 2019 (AEST 12:23 PM), the REA stock was trading at AUD 109.050, up 0.916% by AUD 0.990. In addition, the REA stock has delivered positive returns of 45.52% YTD, 40.56% in the last six months and 11.82% in the last three months.
ResMed Inc.
Healthcare sector player, ResMed Inc. (ASX:RMD) is engaged in the development, manufacturing and commercialisation of medical equipment for the treatment of sleep disordered breathing. The company sells diagnostic and treatment devices in various countries through its subsidiaries and independent distributors.
FY19 Results â For the fiscal year ended 30 June 2019 (FY19), ResMed reported net revenue of USD 2.61 billion, up on USD 2.34 billion recorded in FY18 and a gross profit of USD 1.54 billion, up on USD 1.36 billion recorded in FY18. Also, during FY19, the company invested ~ USD 180.7 million on R&D activities, which represented 6.9% of net revenues with a continued focus on the development and commercialisation of new, innovative products (AirFit F30, AirFit N30i and P30i) and solutions that improve patient outcomes, creating efficiencies for the customers and lowering healthcare costs.
The companyâs Board also declared an ordinary fully paid dividend of USD 0.039 (Record Date: 15 August 2019; Payment Date: 19 September 2019) concerning one quarter period to 30 June 2019.
Stock Performance- RMDâs market capitalisation stands at around AUD 27.92 billion with ~ 1.43 billion shares outstanding. On 23 September 2019 (AEST 12:32 PM), the RMD stock was trading at AUD 19.920, up 2.259% with ~ 261,928 shares traded. In addition, the RMD stock has delivered positive returns of 21.45% YTD and 40.35% in the last six months.
Disclaimer
This website is a service of Kalkine Media Pty. Ltd. A.C.N. 629 651 672. The website has been prepared for informational purposes only and is not intended to be used as a complete source of information on any particular company. Kalkine Media does not in any way endorse or recommend individuals, products or services that may be discussed on this site. Our publications are NOT a solicitation or recommendation to buy, sell or hold. We are neither licensed nor qualified to provide investment advice.
