


- Transporting electricity through high-voltage transmission lines from generators to large industrial energy users;
- Transmitting electricity to local electricity distributors in each region, allowing distributors to light up homes and businesses;
- Facilitating electricity transmission from generators to consumers through its spot market, which aggregates the output from all generators and schedule at a five-minute interval to meet demand.
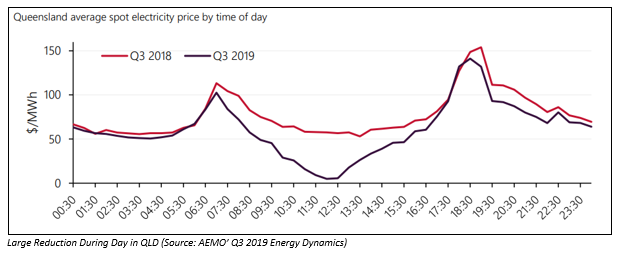
 In Queensland, the growth of large scale and rooftop solar in absence of storage capacity had dragged by average midday price of electricity in the region close to zero in the September quarter, according to the Australian Energy Market Operator.
In its Quarterly Energy Dynamics Q3 2019, AEMO quoted;
âWith low operational demand and high daytime solar output, de-rating of the interconnector led to excess Queensland supply and several trading intervals reaching prices below -$400/MWhâ
In Queensland, the growth of large scale and rooftop solar in absence of storage capacity had dragged by average midday price of electricity in the region close to zero in the September quarter, according to the Australian Energy Market Operator.
In its Quarterly Energy Dynamics Q3 2019, AEMO quoted;
âWith low operational demand and high daytime solar output, de-rating of the interconnector led to excess Queensland supply and several trading intervals reaching prices below -$400/MWhâ
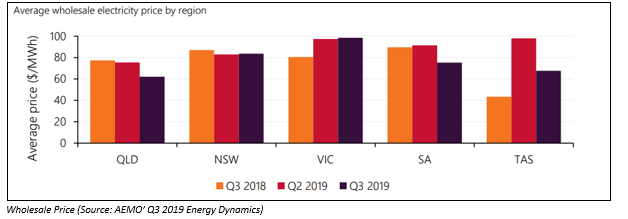
 In South Australia, the spot price for electricity was zero or negative 8.4% of the time in the September 2019 quarter, compared to 3.4% of the time in Q3 2018, while the frequency of negative prices remained comparatively lower in the other regions (NSW, Victoria and Tasmania) served by NEM.
Factors that drove negative prices in South Australia included high variable renewable energy (VRE) output, and major negative intervals occurred when SA VRE output exceeded 1,100 MW.
In addition, the interconnector constraints also led prices to hit negative territory, and AEMO also invoked constraints to limit energy transfer on the VIC-SA interconnectors due to abnormal weather conditions.
Is Supply At Risk?
Industry participants in the renewable energy markets in the country are facing heat from the Australian Energy Market Commission (AEMC). AEMC, having rejected ambitious plans of industry participants to move away from the existing method of assessing transmission and network losses, has insisted its proposals.
The method-in-use presently â âmarginal loss factorsâ, which is used to calculate power lost during transmission, would not go out of service, while rejecting industry participantsâ push for average loss factors method, suggested an AEMC draft ruling.
Industry participants have voiced out opinions, warning that new investments are at the risk as financiers and developers are losing confidence in the Australian markets, according to media reports.
The rule change request was placed before AEMC by Adani Renewables along with other wind and solar developers, including a highly sophisticated group of investors that had advised investments would vanish without the changes.
Electricity generators are pushing for a modification in the structure of the way losses of electricity during transmission are allocated, after witnessing downgrades in the expected revenue.
AEMC noted that investments in new wind and solar plants would be encouraged in the strongest part of grid. It was said that a change in the rule would potentially result in consumers paying for inefficient investments in generators located in remote and congested areas.
However, AEMC has also acknowledged the need for more flexible terms in loss calculation, emphasising to improve the predictability of losses around the network due to transmission.
Meanwhile, the commission is working on several reforms, including right sales to generators to have greater control over access to the network, adoption of new technologies by national electricity grid such as electric vehicle and battery storage, among others.
Futures Market
In Q3 2019, the ASX Electricity futures had depicted an upward trend, while calendar 2020 (Cal20) swaps made record average high across all regions.
In South Australia, the spot price for electricity was zero or negative 8.4% of the time in the September 2019 quarter, compared to 3.4% of the time in Q3 2018, while the frequency of negative prices remained comparatively lower in the other regions (NSW, Victoria and Tasmania) served by NEM.
Factors that drove negative prices in South Australia included high variable renewable energy (VRE) output, and major negative intervals occurred when SA VRE output exceeded 1,100 MW.
In addition, the interconnector constraints also led prices to hit negative territory, and AEMO also invoked constraints to limit energy transfer on the VIC-SA interconnectors due to abnormal weather conditions.
Is Supply At Risk?
Industry participants in the renewable energy markets in the country are facing heat from the Australian Energy Market Commission (AEMC). AEMC, having rejected ambitious plans of industry participants to move away from the existing method of assessing transmission and network losses, has insisted its proposals.
The method-in-use presently â âmarginal loss factorsâ, which is used to calculate power lost during transmission, would not go out of service, while rejecting industry participantsâ push for average loss factors method, suggested an AEMC draft ruling.
Industry participants have voiced out opinions, warning that new investments are at the risk as financiers and developers are losing confidence in the Australian markets, according to media reports.
The rule change request was placed before AEMC by Adani Renewables along with other wind and solar developers, including a highly sophisticated group of investors that had advised investments would vanish without the changes.
Electricity generators are pushing for a modification in the structure of the way losses of electricity during transmission are allocated, after witnessing downgrades in the expected revenue.
AEMC noted that investments in new wind and solar plants would be encouraged in the strongest part of grid. It was said that a change in the rule would potentially result in consumers paying for inefficient investments in generators located in remote and congested areas.
However, AEMC has also acknowledged the need for more flexible terms in loss calculation, emphasising to improve the predictability of losses around the network due to transmission.
Meanwhile, the commission is working on several reforms, including right sales to generators to have greater control over access to the network, adoption of new technologies by national electricity grid such as electric vehicle and battery storage, among others.
Futures Market
In Q3 2019, the ASX Electricity futures had depicted an upward trend, while calendar 2020 (Cal20) swaps made record average high across all regions.
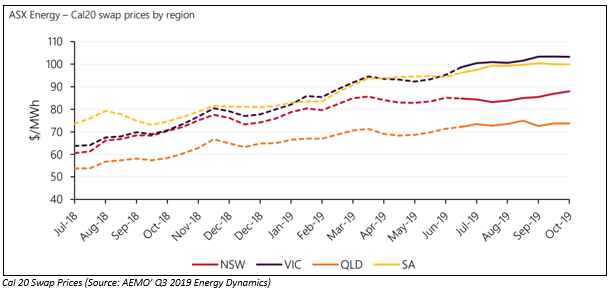 Meanwhile, in Q3 2019, the Victoria Cal20 averaged $102/MWh, an increase of approximately $7.50 each MWh compared to Q2 2019, and Q1 2020 cap product increased by around $11 MWh compared to Q2 2019.
Disclaimer
This website is a service of Kalkine Media Pty. Ltd. A.C.N. 629 651 672. The website has been prepared for informational purposes only and is not intended to be used as a complete source of information on any particular company. Kalkine Media does not in any way endorse or recommend individuals, products or services that may be discussed on this site. Our publications are NOT a solicitation or recommendation to buy, sell or hold. We are neither licensed nor qualified to provide investment advice.
