


All those stocks with market capitalisation above $10 Bn are considered to be large cap stocks, whereas those stocks with market capitalisation between $2 Bn to $10 Bn are considered to be mid cap stocks. Important benchmark for large-cap and small-cap are S&P/ASX 50 and S&P/ASX MidCap 50, respectively. Recently both S&P/ASX 50 and S&P/ASX MidCap 50 made their fresh 52-week high at 6807.20 and 7372.00, respectively, on July 30, 2019.
Lendlease Group (ASX:LLC)
International property and infrastructure company, Lendlease Group (ASX:LLC) has core expertise in shaping cities and creating strong and connected communities. Recently, Mitsubishi UFJ Financial Group, Inc., ceased to be substantial holder in the company, effective from October 31, 2019.
In another update, the company appointed Baroness Margaret Ford OBE to the position of independent Non-Executive Director. This will take effect from March 1, 2020. She has an extensive sector experience in development and construction, and infrastructure financing, and over a period of thirty years she has chaired both listed and privately-owned companies and led large Government bodies.
FY19 Key Highlights for the period ended on June 30, 2019: Profit after tax for the period was reported at $467 Mn, whereas PAT from core operations was reported at $804 Mn. The group reported after tax loss of $337 Mn from non-core business i.e. engineering and services. Earnings per stapled security for the full year period was reported at 82.4 cents.
Under strategic initiatives, the company secured three major urbanisation projects in Milan, Chicago and Sydney. Companyâs development pipeline is now approaching $100 Bn in project value underpinning a very strong long-term outlook.
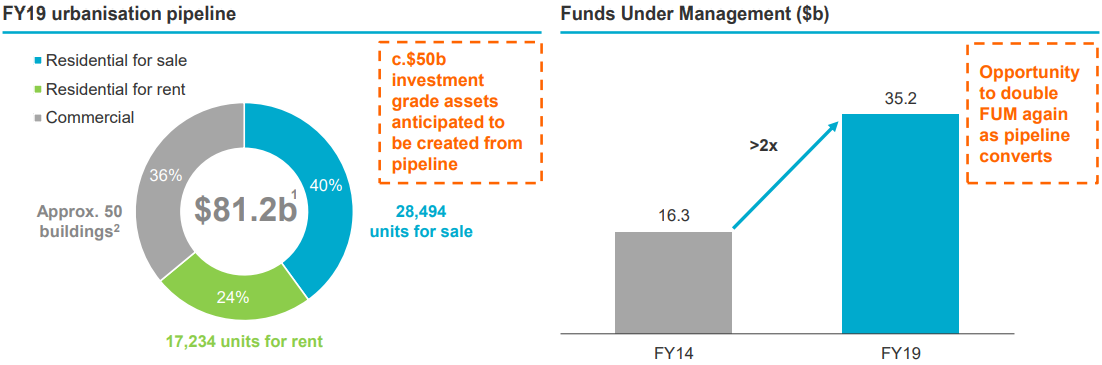
Urbanization Pipeline (Source: Company Reports)
On the stock information front
On November 8, 2019, the stock of Lendlease Group traded at $19.27 up 1.528%, with the market capitalization of ~$10.71 Bn. Its current PE multiple, dividend yield and EPS stand at 22.900x, 2.21% and 0.829 AUD, respectively. It has generated an absolute return of 9.58% for the last one year, 44.77% for the last six months, and 36.84% for the last three months.
Magellan Financial Group Limited (ASX:MFG)
Magellan Financial Group Limited (ASX:MFG) is involved in funds management. It targets offering international investment funds to retail as well as high net worth investors. These are offered in New Zealand and Australia and to institutional investors globally. Recently, the company published its funds under management monthly update where it highlighted net inflows of $1,385 Mn in October 2019, where net retail inflows and net institutional inflows in the October month stood at $1,125 Mn and $260 Mn, respectively. Exposure to Global equities, Infrastructure equities and Australian equities increased by $884 Mn, $578 Mn and $10 Mn, respectively, as compared to September month.
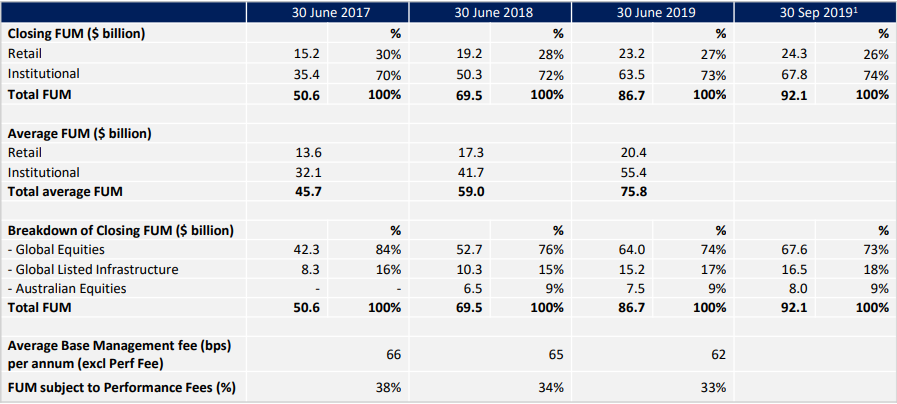
Quarterly FUM Summary (Source: Company Reports)
As per investment performance, Magellan Global Fund posted decent per annum return of 15.7%, 18.2%, 15.7% and 12.4% for one year, three years, five years and since inception, respectively, as compared to benchmark âMSCI World NTR Indexâ per annum return of 9.2%, 14.9%, 12.9% and 6.7% for one year, three years, five years and since inception, respectively. Magellan Infrastructure Fund posted a per annum return of 20.9%, 11.9%, 13.0% and 9.2% for one year, three years, five years and since inception, respectively, as compared to benchmark âGlobal Listed Infrastructure Benchmarkâ per annum return of 16.7%, 8.7%, 8.4% and 6.2% for one year, three years, five years and since inception, respectively.
On the stock information front
On November 8, 2019, the stock of Magellan Financial Group traded at $49.330 with the market capitalization of ~$9.01 Bn. Its current PE multiple, dividend yield and EPS stand at 23.210x, 3.74% and 2.131 AUD, respectively. It has generated an absolute return of 82.31% in the past one year, 12.23% in six months, and -15.74% in three months.
Fortescue Metals Group Ltd (ASX:FMG)
Iron ore explorer and developer giant Fortescue Metals Group Ltd (ASX:FMG) recently published its Septemberâ19 quarter production report, where it highlighted that Safety total recordable injury frequency rate (TRIFR) for the period improved by 4% to 2.7, as compared to previous quarter. Shipments for the quarter stood at 42.2mt, up by 5% than Q1FY19. C1 costs for the period stood at US$12.95/wmt, a 2% decline than Q1FY19. Average revenue received increased by 89% to US$85 per dry metric tonne (dmt), as compared to US$45/dmt in the previous quarter. Net debt as on September 30, 2019 was reported at US$0.5 Bn, as compared to US$2.1 Bn on June 30, 2019. Companyâs cash on hand at the end of the quarter increased to US$3.4 Bn as compared to US$1.9 Bn on June 30, 2019. This cash balance would be used in the payment of FY19 final dividend of US$0.5 Bn in October and the FY19 final tax payment of US$0.6 Bn, due in December.
Total capital expenditure for the quarter stood at US$421 Mn, inclusive of sustaining capital, exploration and development expenditure. Total exploration expenditure for the quarter stood at US$33 Mn.
FY20 guidance states 170-175 mt in shipments, including 17-20 mt of West Pilbara Fines product. C1 costs for FY20 has been estimated to be in the range of US$13.25 - 13.75/wmt. Total capital expenditure and Depreciation and amortisation has been estimated at US$2.4 Bn and US$7.70/wmt, respectively. Total dividend pay-out ratio for FY20 has been estimated to be between 50% and 80% of full year net profit after tax.

FY19 Key Metrics (Source: Company Reports)
On the stock information front
On November 8, 2019, the stock of Fortescue Metals Group traded at $9.580 up 0.736% with the market capitalization of ~$29.28 Bn. Its current PE multiple, dividend yield and EPS stand at 6.470x, 4.52% and 1.470 AUD, respectively. It has generated an absolute return of 143.37% for the last one year, 34.07% for the last six months, and 34.89% for the last three months.
BHP Group Limited (ASX:BHP)
BHP Group Limited (ASX:BHP) is involved in the mining of metallurgical coal and energy coal, iron ore, copper, silver, zinc, molybdenum, uranium and gold; and exploration, development and production of oil and gas. Recently, the company informed the market that Ernst & Young has been appointed as companyâs external auditor, effective from November 7, 2019. This was necessary after the resignation of KPMG due to UK and EU requirements on auditor tenure. In another update, the company approved BHP Billiton Brasil Ltdaâs share of funding worth US$44 Mn for work related to the restart of one concentrator at Samarco Mineração S.A.âs operations which were suspended following the failure of the Fundão dam on November 5, 2015. Presently, Vale S.A. and BHP Billiton Brasil Ltda. each hold 50% interest in Samarco Mineração.
Septemberâ19 Quarter Key Highlights: Groupâs copper equivalent production for the period decreased by 3%, mainly due to planned maintenance across a number of operations and natural field decline in Petroleum. The company has kept all production and unit cost guidance unchanged for the financial year 2020.
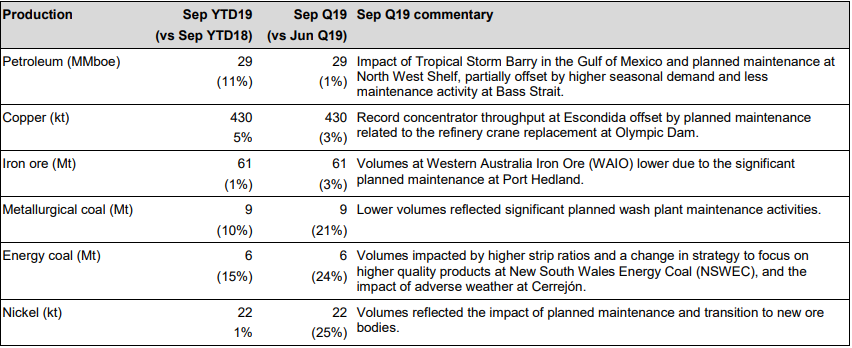
Quarterly Production Update (Source: Company Reports)
On the stock information front
On November 8, 2019, the stock of BHP Group traded at $37.300 down 0.134% with the market capitalization of ~$110.03 Bn. Its current PE multiple, dividend yield and EPS stand at 16.340x, 5.13% and 2.286 AUD, respectively. It has generated an absolute return of 16.66% for the last one year, 0.13% for the last six months, and 1.63% for the last three months.
Resmed Inc (ASX:RMD)
Resmed Inc (ASX:RMD) provides innovative medical solutions that treat people suffering from sleep apnoea, COPD and other chronic diseases. Recently, the company issued 1,437,692,440 CDI equivalent of ordinary shares, with average issue price for stock options at US$5.08.
Q1FY20 Key Highlights for the period ended September 30, 2019: Revenue for the period increased by 16% to $681.1 Mn and by 17% on a constant currency basis. This can be attributed to increase in revenue by 13% in the U.S., Canada, and Latin America, excluding Software as a Service, whereas revenue in combined Europe, Asia and other markets grew by 8% on a constant currency basis as compared to previous period. Revenue from Software as a Service increased by 83% as compared to the prior year period, due to continued growth in Brightree service offerings and incremental contribution from the acquisition of MatrixCare, which closed in the second quarter of FY19.
Gross margin increased by 120 bps to 59.5%. Selling, general and administrative expenses for the period increased by 14% to $167.4 Mn, and expenses under Research and development (R&D) increased by 24% to $48.0 Mn. Income from operations increased by 19% to $171.1 Mn. Net operating profit increased by 19%. The Board of Directors declared $0.39 per share as a quarterly cash dividend, with record date and payment date on November 7, 2019 and December 12, 2019, respectively.

Quarterly Income Statement (Source: Company Reports)
On the stock information front
On November 8, 2019, the stock of BHP Group traded at $20.710 down 1.193% with the market capitalization of ~$30.05 Bn. Its current PE multiple, dividend yield and EPS stand at 52.000x, 0.73% and 0.403 AUD, respectively. It has generated an absolute return of 45.05% for the last one year, 31.58% for the last six months, and 10.67% for the last three months.
Disclaimer
This website is a service of Kalkine Media Pty. Ltd. A.C.N. 629 651 672. The website has been prepared for informational purposes only and is not intended to be used as a complete source of information on any particular company. Kalkine Media does not in any way endorse or recommend individuals, products or services that may be discussed on this site. Our publications are NOT a solicitation or recommendation to buy, sell or hold. We are neither licensed nor qualified to provide investment advice.
