


Iron ore prices almost reached the level of $100 as the prices of the Chicago Mercantile Exchange 62% graded index is currently trading at $99.34 (as on 27th May 2019 AEST 7:26 PM), up by 1.21% as compared to its previous close of US$98.14 on 24th May 2019. The commodity is trading on a multi-year high.
The recent upsurge in prices is majorly due to the shortage in the supply chain and high demand in China. Due to the deficit in the global supply, prices in China also marked an uptick. The 62% graded iron ore index on the Dalian Commodity Exchange (DCE) in China surged to the level of RMB 732 (as on 24th May 2019) up by 0.48% as compared to its previous close.
Iron ore inventories across the 35 significant ports in China marked a steep decline after initially falling to the level of 123.67 million tonnes (for the week ended 17th May). As per the data, the iron ore stockpiles across these ports further shrank by 5.38 million metric tonnes (for the week ended 24th May 2019).
Apart from a weekly decline, the iron ore inventory decline by 28.22 million metric tonnes on a yearly basis, amid a decline in shipments from the Australian and Brazilian ports. The overall inventory across the 35 ports stood at 118.29 million metric tonnes (for the week ended 24th May), down by almost 4.36% as compared to the inventory level of 123.67 million metric tonnes previously.
As per the data, the average supply in Tangshan- highest steelmaking provinces in China, decreased by 800,000 metric tonnes for the week ended 24th May 2019.
On the demand front, the demand for steel raw material is high in China, due to which the average deliveries inched up. The average deliveries from the Chinese ports increased by 59,000 metric tonnes on a weekly basis and by 151,000 metric tonnes on a yearly basis.
The inched up iron ore prices amid supply shortage and high Chinese demand, prompted share prices of a significant Australian Iron ore miner- Rio Tinto (ASX: RIO) to touch the 52-week high (Also Dayâs High on 27 May 2019), finally settling at A$103.020, up by 1.75%.
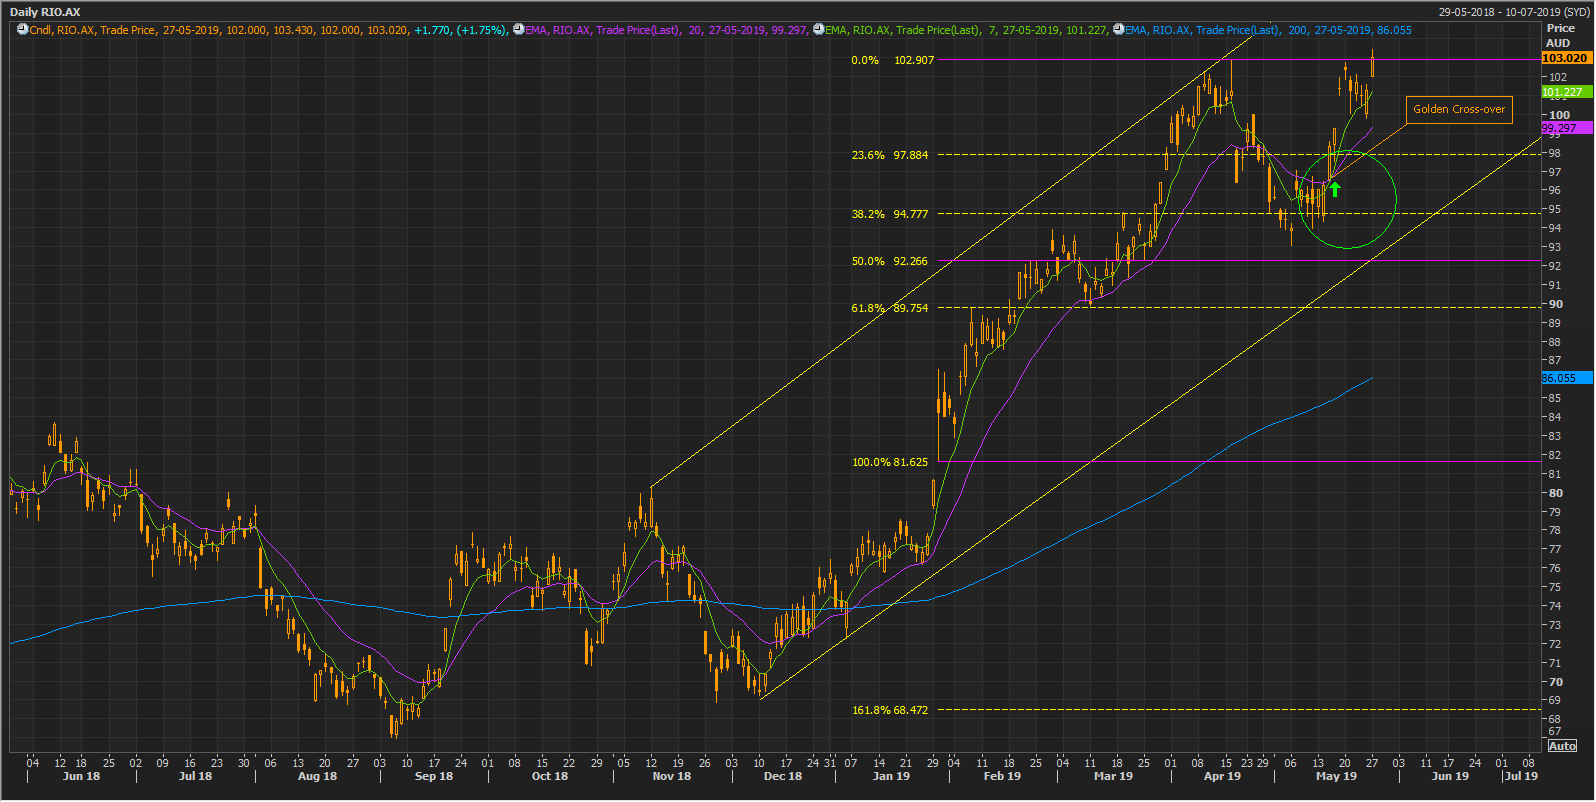 Rio Tinto Daily Chart (Source: Thomson Reuters)
On following the daily chart, it can be seen that the share prices of the company are in a continuous uptrend, and the prices are above the trio of 7,20,200-days exponential moving averages (EMAs). The 7-days EMA is at A$101.227, while 20-days EMA is at A$99.297. The pair of 7and 20-days EMA crossed each other at the point marked as a green arrow on the chart.
The short-term 7-days EMA crossed the medium-term 20-days EMA from below, which marked the emergence of a golden cross-over (Bullish signal). The prices corrected almost by 50% before resuming the initial uptrend.
The second correction was above the previous correction, which gave us two points to connect and check for Fibonacci extensions.
Rio Tinto Daily Chart (Source: Thomson Reuters)
On following the daily chart, it can be seen that the share prices of the company are in a continuous uptrend, and the prices are above the trio of 7,20,200-days exponential moving averages (EMAs). The 7-days EMA is at A$101.227, while 20-days EMA is at A$99.297. The pair of 7and 20-days EMA crossed each other at the point marked as a green arrow on the chart.
The short-term 7-days EMA crossed the medium-term 20-days EMA from below, which marked the emergence of a golden cross-over (Bullish signal). The prices corrected almost by 50% before resuming the initial uptrend.
The second correction was above the previous correction, which gave us two points to connect and check for Fibonacci extensions.
 Rio Tinto Daily Chart (Source: Thomson Reuters)
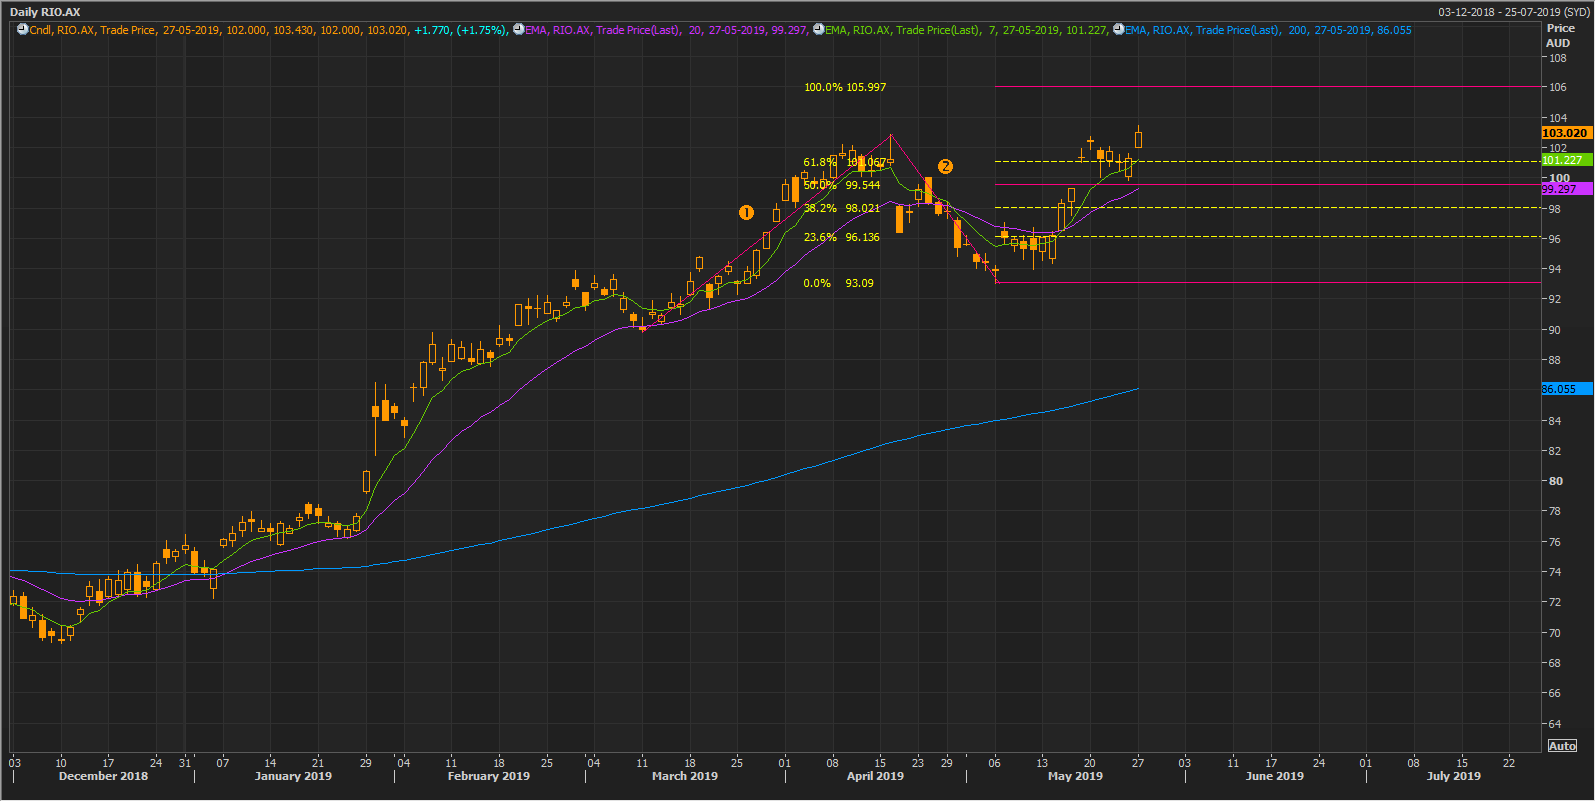
The previous correction to the first rise is marked as (1) and the second correction is marked as (2), post connecting the lows of these corrections, the Fibonacci results are; 23.6% (A$93.136), 38.2% (A$98.021), 50.0% (A$99.544), 61.8% (A$101.067), 100.0% (A$105.997).
Rio Tinto Daily Chart (Source: Thomson Reuters)
The previous correction to the first rise is marked as (1) and the second correction is marked as (2), post connecting the lows of these corrections, the Fibonacci results are; 23.6% (A$93.136), 38.2% (A$98.021), 50.0% (A$99.544), 61.8% (A$101.067), 100.0% (A$105.997).
Disclaimer
This website is a service of Kalkine Media Pty. Ltd. A.C.N. 629 651 672. The website has been prepared for informational purposes only and is not intended to be used as a complete source of information on any particular company. Kalkine Media does not in any way endorse or recommend individuals, products or services that may be discussed on this site. Our publications are NOT a solicitation or recommendation to buy, sell or hold. We are neither licensed nor qualified to provide investment advice.
