


The crude oil market is currently trading lower amid high inventory in the U.S. Crude oil and ongoing tariff war.
After posting a highest monthly loss in May post a four-month continuous rise, the Brent Crude oil futures of the August series slipped further to the level of US$ 59.45 (Dayâs low on 5th June 2019), from where the prices are recovering. The prices are currently hovering at US$62.52 (as on 7th June 2019 AEST 3:48 PM).
Crude Oil on a Daily Chart:
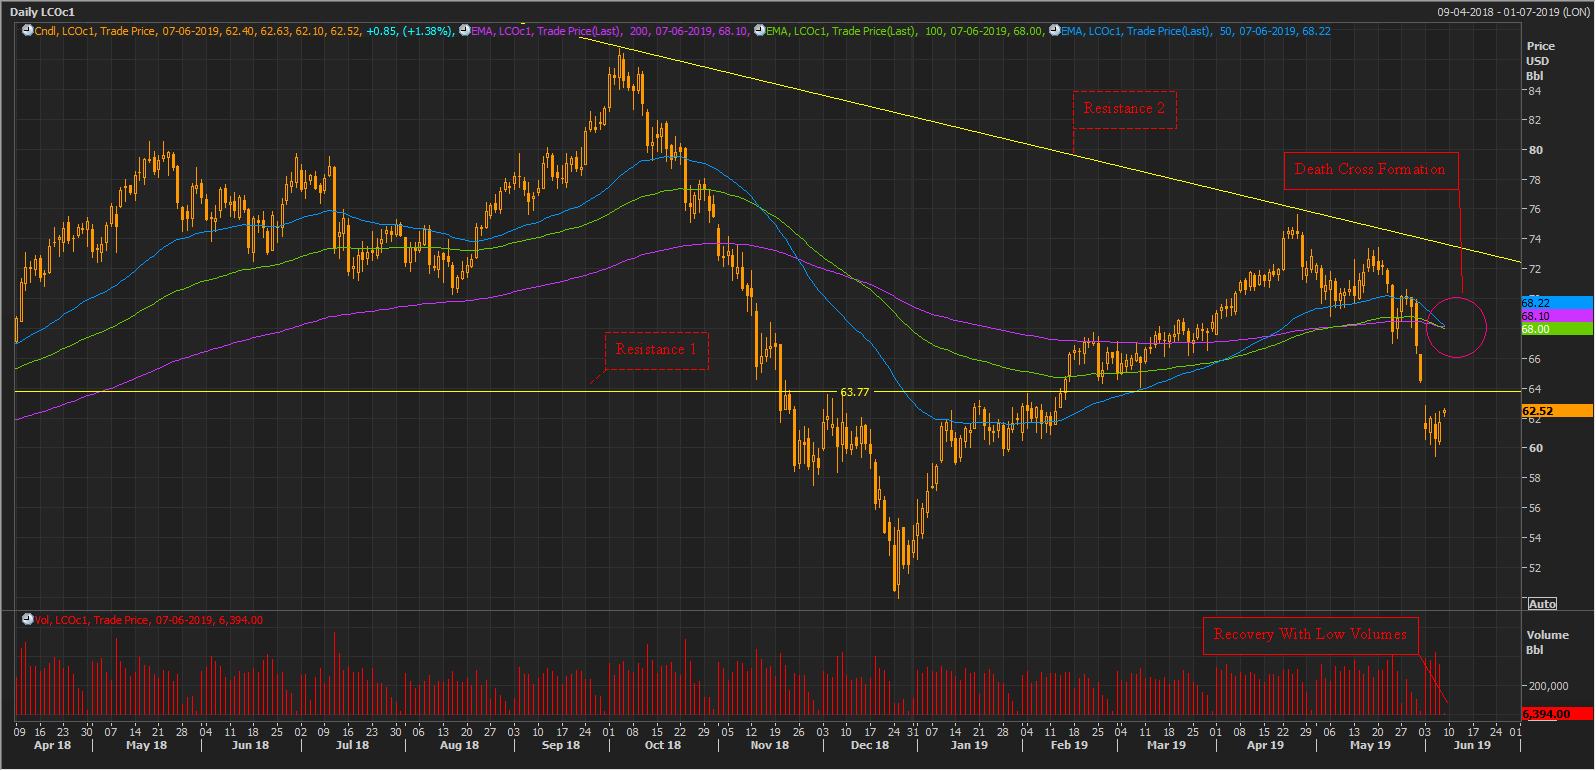
LCO Daily Chart (Source: Thomson Reuters)
On the daily chart, the crude oil prices recently slipped below its support level of approx. US$63.77, which now acts as resistance on a daily chart and is quoted as Resistance 1 on the chart shown above.
The group of moving averages 50,100,200-days exponential moving averages are on the verge of making a Death Cross (bullish signal) formation on a daily chart. The 100-days exponential moving average has crossed the 200-days exponential moving average from above, and in the recent price environment, the 50-days exponential moving average is also moving towards the cross-over of 100 and 200-days exponential moving average.
Post discussing and observing the daily chart let us now look over the bigger picture of the crude oil market.
Crude Oil on a Monthly Chart:
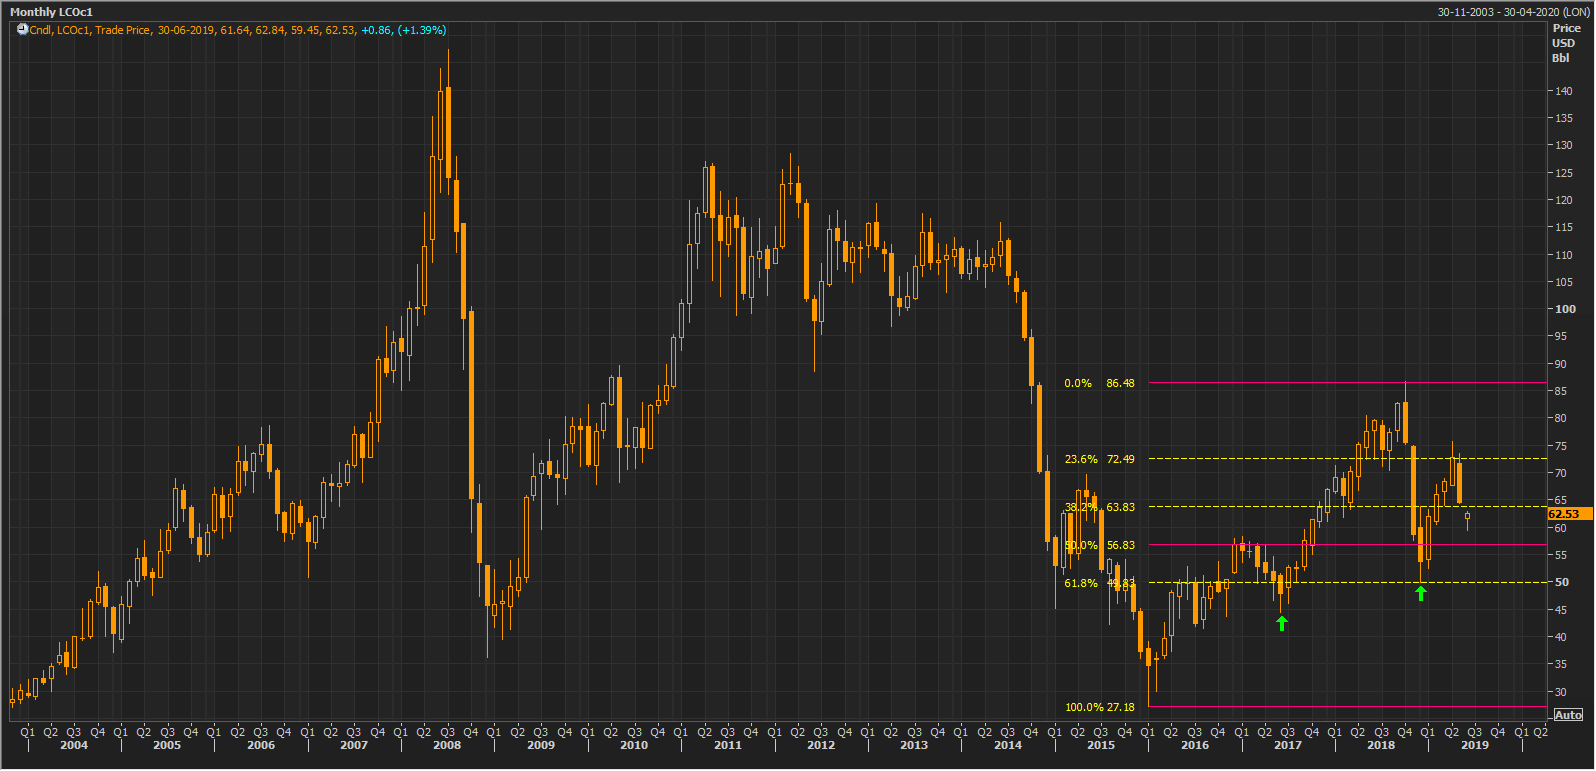
LCO Monthly Chart (Source: Thomson Reuters)
On a monthly chart, we can notice that the crude oil prices recovered steeply from the level of US$27.10 (low in January 2016) to the level of US$58.37 (high in January 2017), where the prices faced a hurdle and corrected back to the level of US$44.35 (low in June 2017).
After correcting till US$51.45, the prices rose significantly to the level of US$86.74 (high in October 2018). Post hitting the top of US$86.74, the crude oil prices corrected by almost 61.8 per cent of the rally from US$27.10 to US$86.74, to the level of US$49.93 (low in December 2018), and took a support of 61.8 per cent retracement level and rose again.
The above-observed wave moment is shown with green arrows on the chart above.
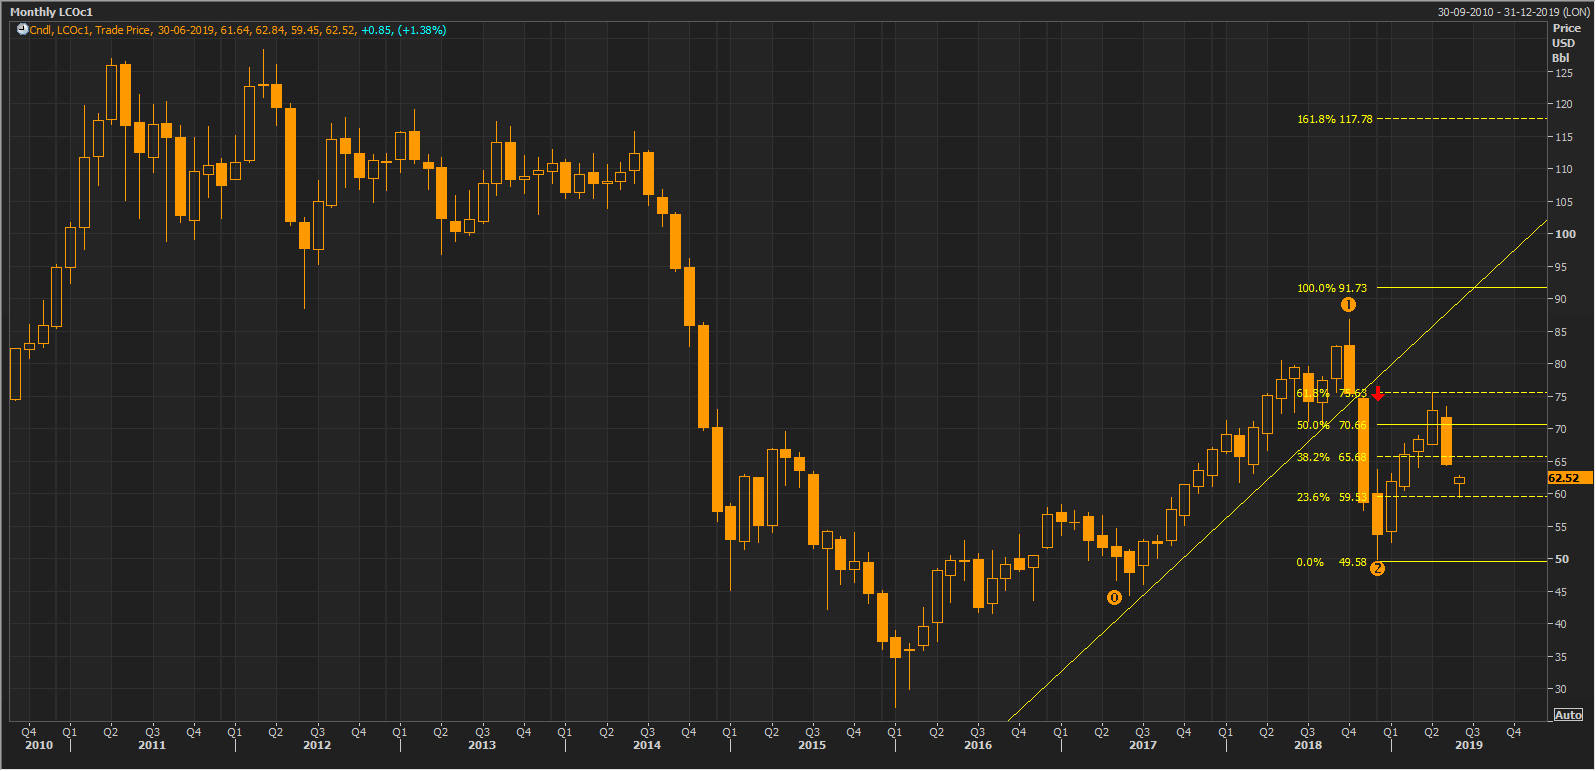
LCO Monthly Chart (Source: Thomson Reuters)
As the June 2017 low of US$44.35 is lower in value than the low of December 2018, which is at US$ 49.93, it gives us the perfect coordinates to connect the Fibonacci series, and the points of connections are marked as 0,1,2.
The outcome of Fibonacci is; 23.6 per cent is at US$59.93, 38.2 per cent is at US$65.68, 50.0 per cent is at US$70.66, 61.8 per cent is at US$75.63, 100 per cent is at US$91.73, and the 161.8 per cent is at US$117.78.
Post observing the overall crude price actions on Chart, let us now take a look over two energy players on ASX, as these players exhibit a direct correlation with the overall commodity prices; however, a commodity correlation only points at the trend, the stock price and performance of the companies rely on many other factors as well.
Two Energy Players on ASX:
Woodside Petroleum Limited (ASX: WPL)
WPL is an Australian Securities Exchange listed hydrocarbon explorer, producer and developer with a global presence, and the company hosts various hydrocarbon projects such as Wheatstone LNG, Australia Oil, North West Shelf, under the business portfolio.
WPL and LCO Comparative Chart:
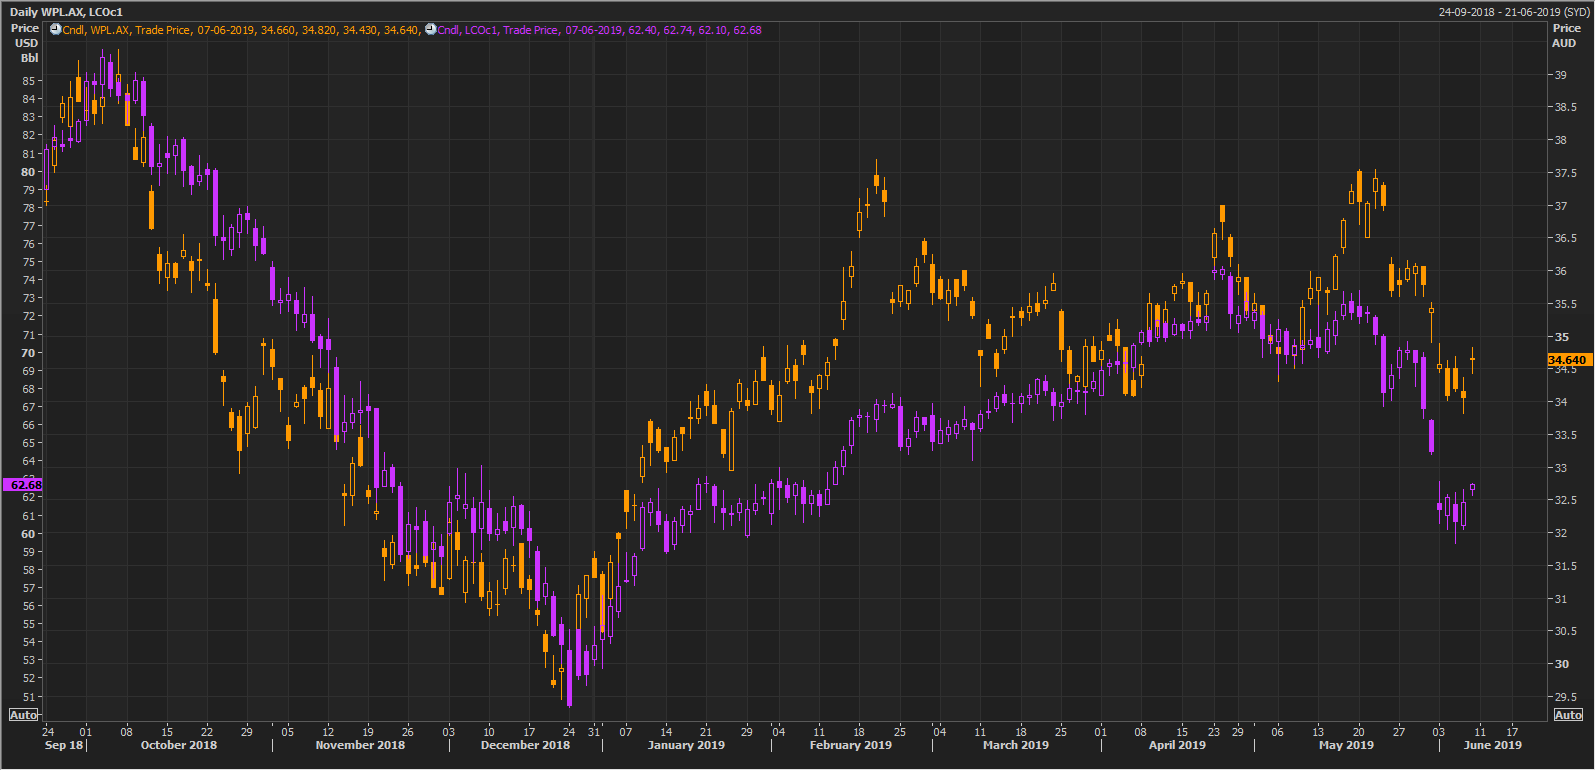
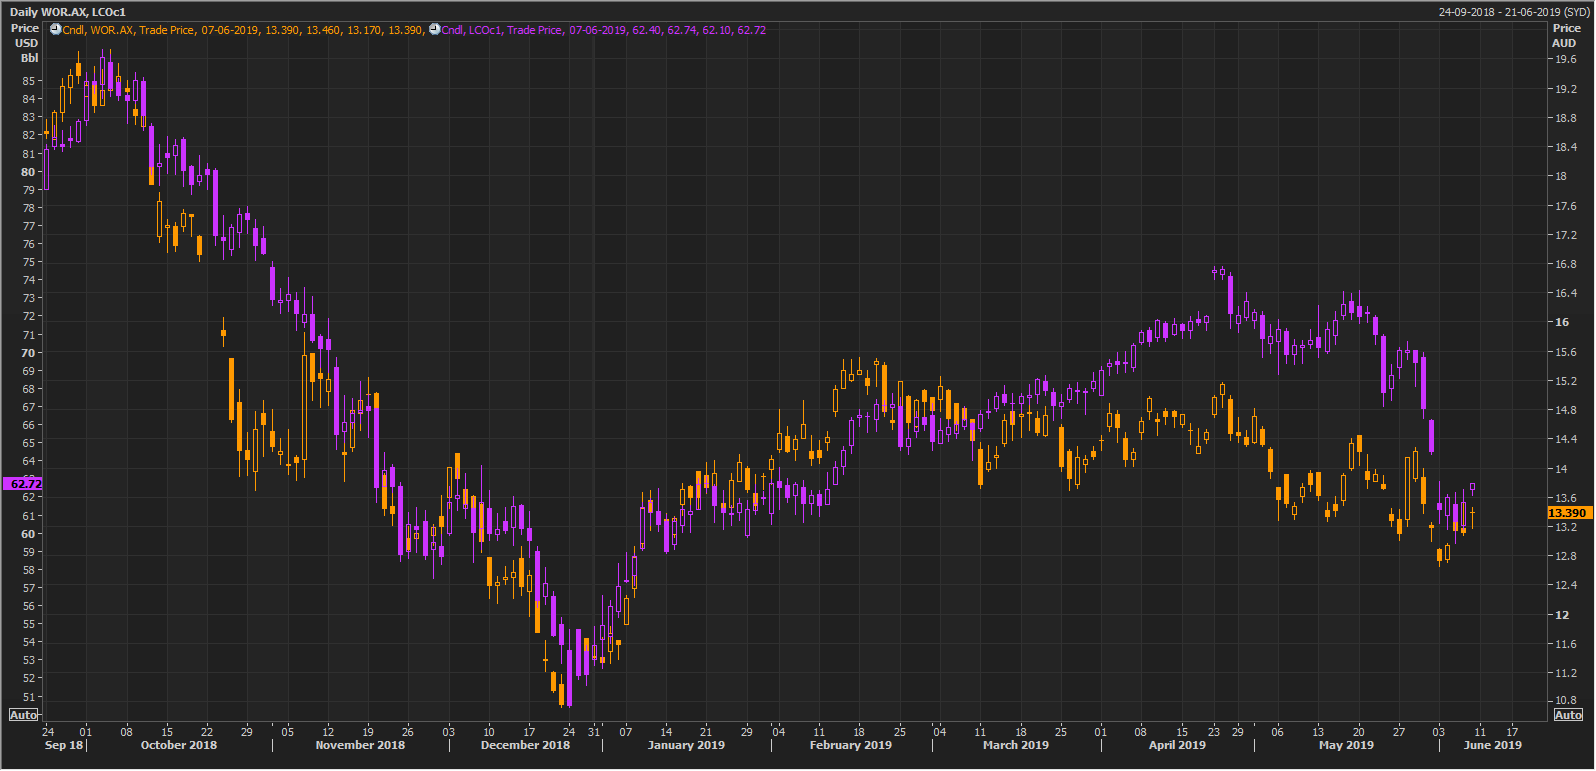
LCO/WPL Comparative Chart (Source Thomson Reuters)
On the above chart, we can see that the share price of the company tracks the movement in crude oil price, as being an energy player, the operations of the company get hampered with the price change in crude oil. However, the magnitude of the price change could differ amid fundamentals aspects or due to an event study, which would not get captured by just merely comparing the price change movement.
WPL on a Daily Chart:
WPL Daily Chart (Source: Thomson Reuters)
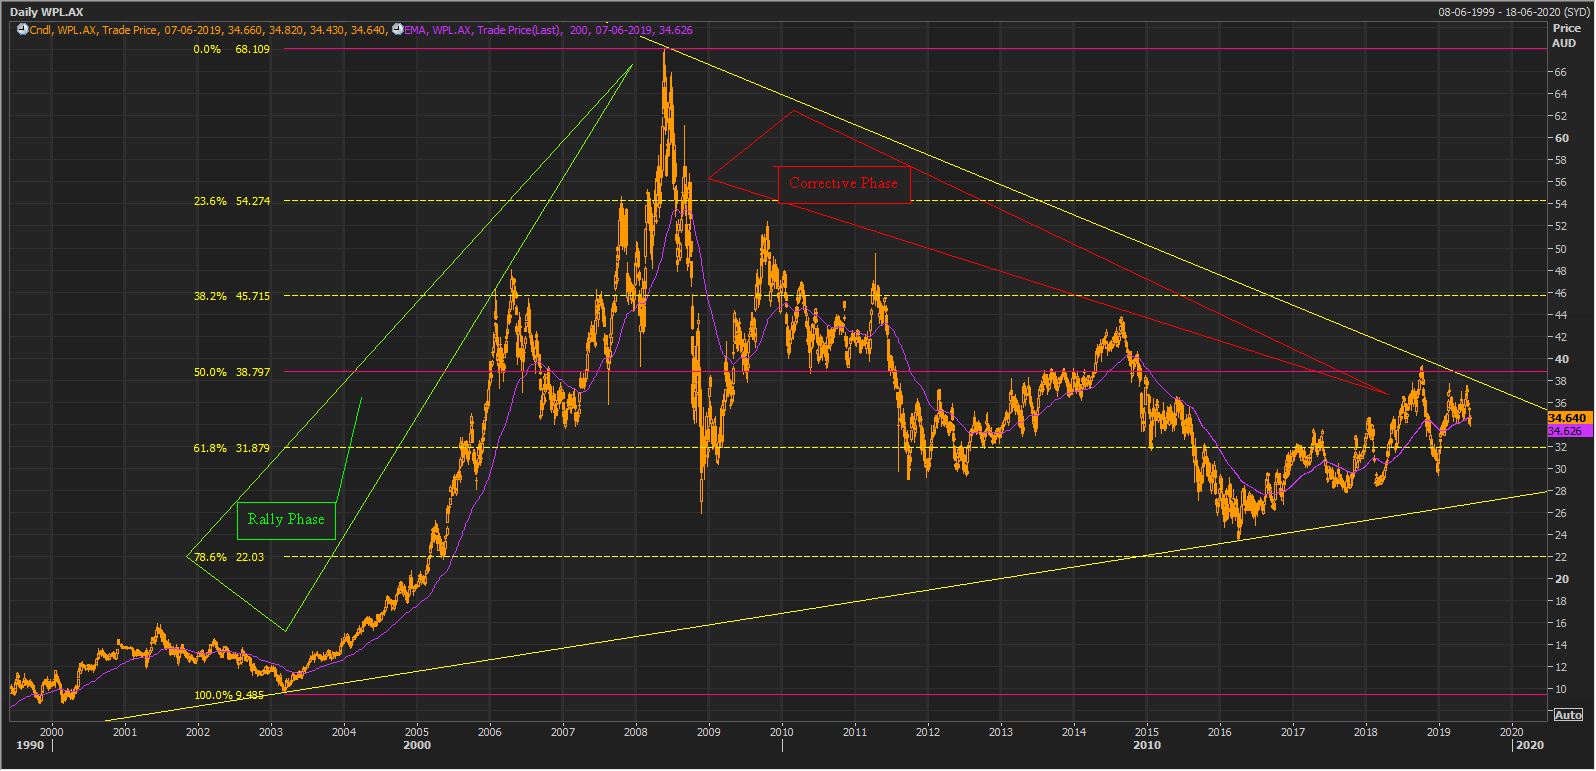
On a daily chart, we can observe that the price actions of the companyâs shares could be seen in two categories, one is the rally phase (green box), and the other is the corrective phase of the initial rally (red box).
The share prices rallied from the year 2003 (approx. A$9.435) till the year 2008 (approx. A$68.109). Post giving such an extended rally the share price of the company moved in a corrective phase, and are currently in the corrective phase, with price below its 200-days exponential moving average, which is at US$34.626.
Corrective Phase Analysis:
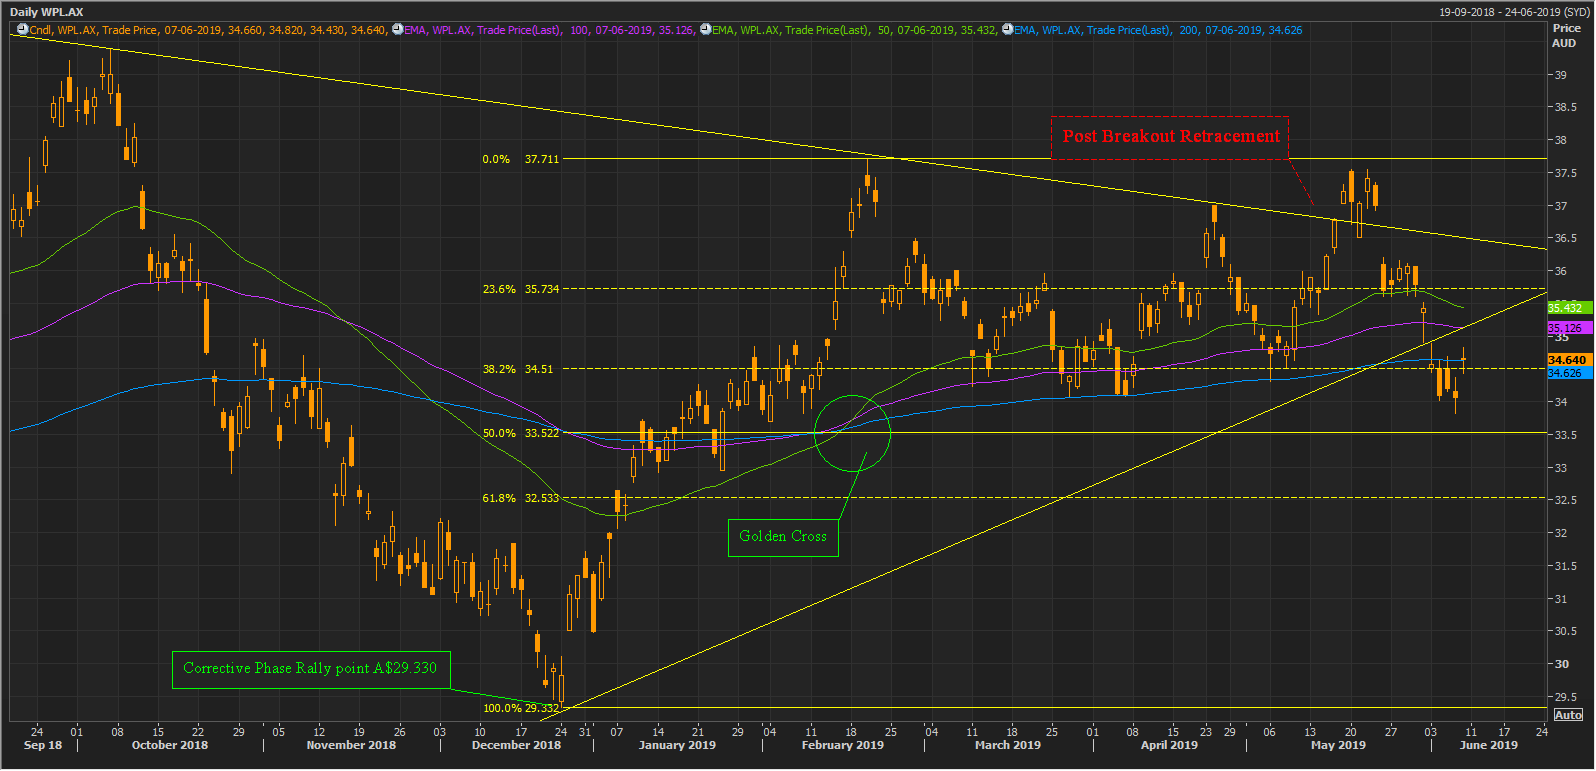
During the corrective phase, the shares rallied from the level of A$29.330 (Dayâs low on 24th December 2018) to the level of A$37.700 (Dayâs high on 20th February 2019).
WPL Daily Chart (Source: Thomson Reuters)
After the rally was halted at A$37.700 the share prices retraced by tad more than 38.2 per cent of the corrective phase rally. However, post correcting the share price bounced from the 200-days exponential moving average and attempted a breakout of the downward sloping trendline. The shares successfully breached the trendline (Ref Chart-Post Breakout Retracement) and it was a false breakout. The WPL shares dropped below the downward sloping support line.
However, the retracement has shown no counter measure of the Golden Cross (bullish signal) which emerged during the rally from A$29.330 to A$37.700.
The stock price briefly traded below the 200-days exponential moving average and currently it is taking support at its 200-days EMA.
WPL Daily Chart (Source: Thomson Reuters)
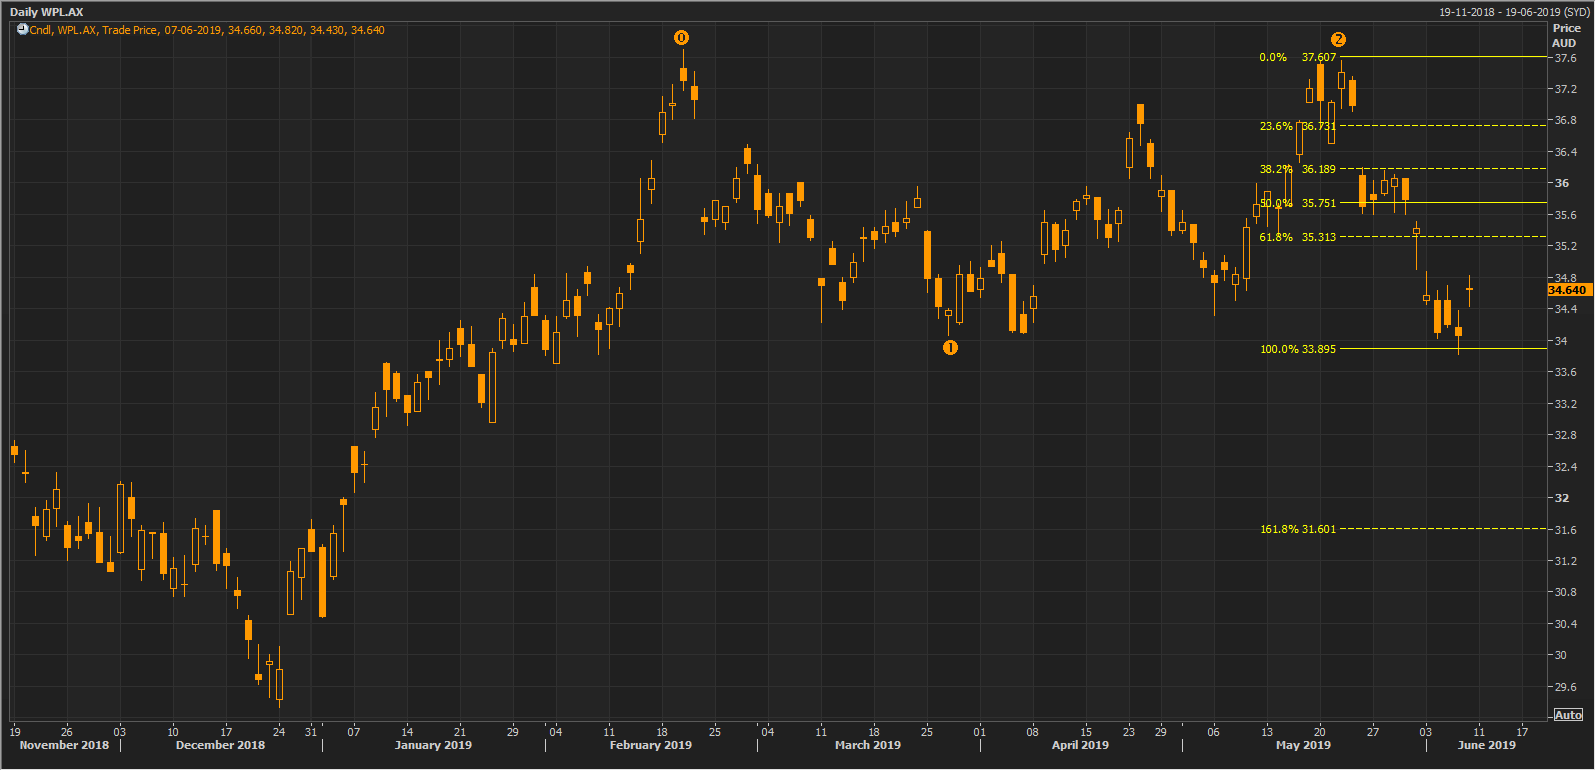
The prices corrected from A$37.700 to the level of A$34.060 (Dayâs low on 27th March 2019) and rose again to the level of A$37.550 (Dayâs high on 22nd May 2019), top of which remained below A$37.700, which in turn gave perfect coordinates to connect the Fibonacci series.
The connection points are marked as 0,1,2 and the result of the connect is: 23.6 per cent is at A$36.731, 38.2 per cent is at A$36.189, 50.0 per cent is at A$37.571, 61.8 per cent is at A$35.313, 100 per cent is at A$33.895, and the 161.8 per cent is at A$31.601.
WorleyParsons Limited (ASX: WOR)
WorleyParsons Limited (ASX:WOR), an Australian Securities Exchange listed consultant and advisory service provider, which recently secured a contract from Intecasa Industrial S.A. The company acquired another service contract from Thai Oil Public Company Limited.

WOR Daily Chart (Source: Thomson Reuters)
Price Actions:
The share price of the company is moving in a short-term downtrend post recovering from a recent bottom of A$10.720 (Dayâs low on 21st December 2019).
The shares recovered from the level of A$10.720 to the level of A$15.500 (Dayâs high on 20th February 2019). After showing a recovery, the shares of the company moved into a downtrend.
From the level of A$15.500, the share prices dropped to the level of A$13.720 (Dayâs low on 11th March 2019) and recovered after that till A$14.990; however, prices remain lower from the level of A$15.500.
After recovering till A$14.990, the prices again plunged on ASX to the level of A$13.010 (Dayâs low on 27th May 2019). The price is currently hovering around A$13.390 (Dayâs close today on ASX).
WOR and LCO Comparative Chart:
LCO/WPL Comparative Chart (Source Thomson Reuters)
On following the comparative chart, we can see that the companyâs share price is influenced by the international crude oil price action. However, again, the percentage price change could differ amid underlying fundamentals of the company or any event impacting the business.
WOR on a Daily Chart:
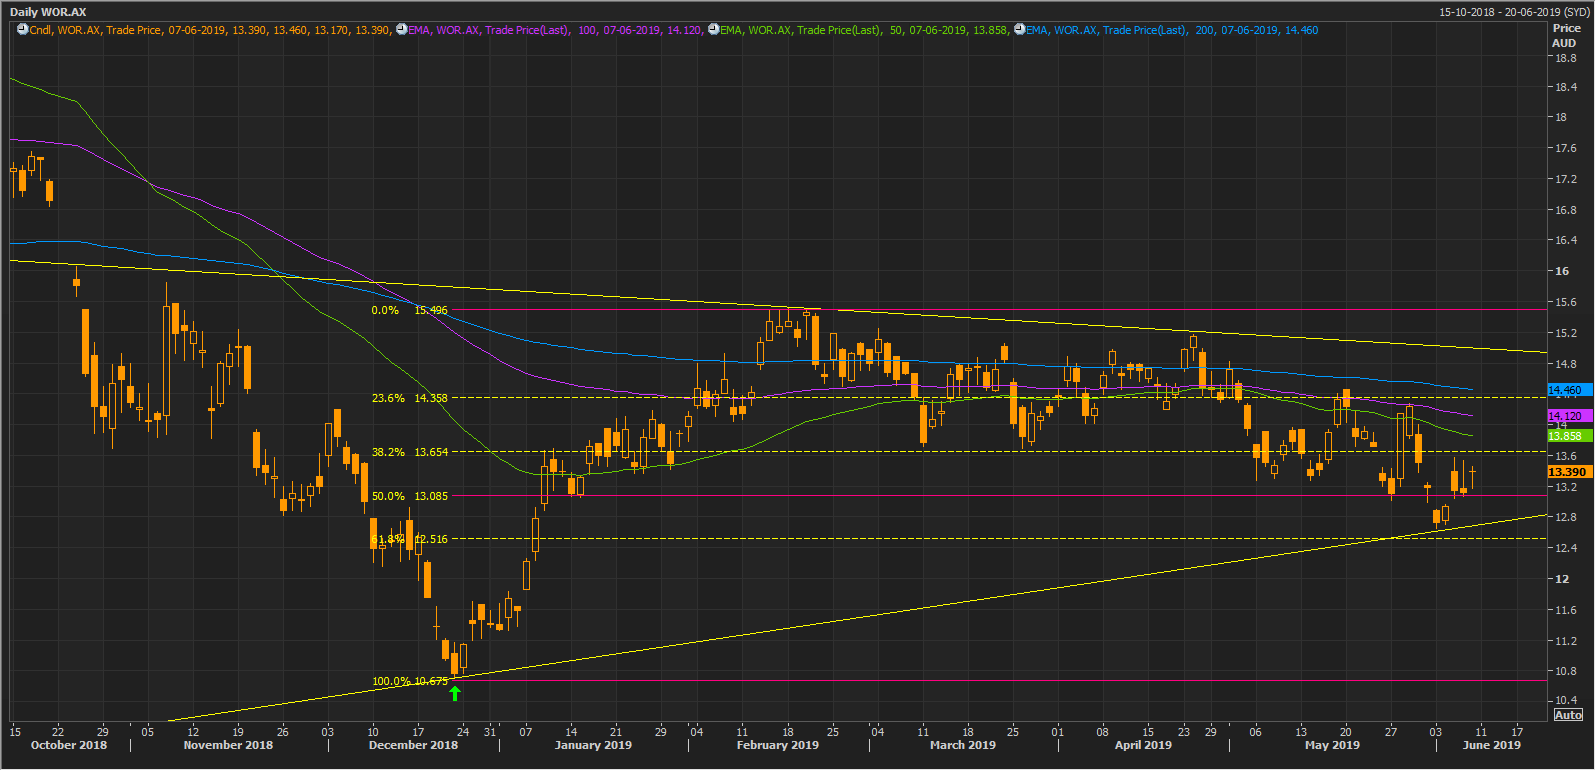
WOR Daily Chart (Source: Thomson Reuters)
On following a daily chart, we can observe that the share rallied from the level of A$10.720 (Dayâs low on 21st December 2018) to the level of A$15.500 (20th February 2019). However, the prices faced the resistance from the downward sloping trendline and fell. The falling prices mark an almost 61.8 per cent of the initial rally from A$10.720 to A$15.500.
The prices are currently trading in a negative moment signified by the moving averages. Currently, prices are below the 50, 100, and 200-days exponential moving averages. And among the moving averages, the 200-days EMA is above the 100-days EMA, and 100-days EMA is above the 50-days EMA, which in turn, suggest a downtrend.
Performance Profile:
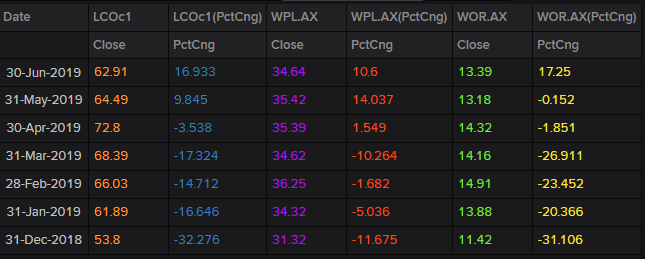
YTD Returns of WOR, WPL, and LCO (Source: Thomson Reuters)
The Crude oil delivered a YTD (Year-to-date) return of 16.933 per cent, while the shares of WPL delivered a return of 10.6 per cent, and the shares of WOR delivered a return of 17.25 per cent.
The shares of WOR outperformed the crude returns, and WPL returns on YTD basis; however, crude oil delivered a superior return in comparison to WPL shares and almost matched the return of WOR on a YTD basis as per the current close of the companies share and present crude oil prices.
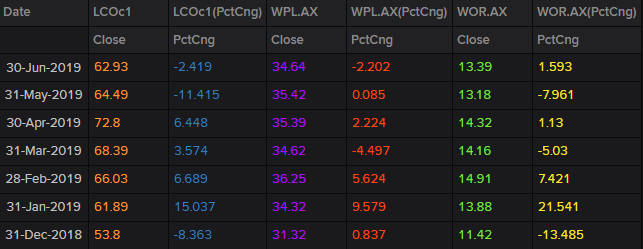
Monthly Returns of WOR, WPL, and LCO (Source: Thomson Reuters)
However, the recent plunging in the crude oil prices reduced the return drastically on a YTD basis. The monthly return on crude stands at -2.419 per cent, while the monthly return on the shares of WPL and WOR is at -2.202 per cent & 1.593 per cent respectively.
In a nutshell, WOR outperformed the crude oil and WPL returns on a YTD basis as well as on a monthly basis.
Disclaimer
This website is a service of Kalkine Media Pty. Ltd. A.C.N. 629 651 672. The website has been prepared for informational purposes only and is not intended to be used as a complete source of information on any particular company. Kalkine Media does not in any way endorse or recommend individuals, products or services that may be discussed on this site. Our publications are NOT a solicitation or recommendation to buy, sell or hold. We are neither licensed nor qualified to provide investment advice.
