


Iron ore prices surged amid a slight fall in the China steel domestic inventories. The benchmark Iron ore Fines 62% Fe Futures (CME) rose from the level of $85.01 (closing on 12th March) to the current level of $85.98. The recent smog alert removal in China, ignited the sintering machines across few mills in China, which meets the china emission standards and in turn demanded iron ore along with coking coal, which supported the iron ore prices.
The prices sure in iron ore prices marked a first observable surge in the prices after a steep fall from the level of $86.76 (dayâs close on 6th March). The steel demand is also expected to be boosted in the short term by the market participants as U.S-China trade talks proceed on a rosy pathway, which observed the U.S. President Donald Trump asking Chinese Counterpart to reduce the tariff on the U.S. agricultural products and Chinaâs promise to buy additional U.S. crops such as Soybean.
The building optimism among the global economies is supporting the steel prices and in turn, providing support to iron ore prices as well. However, with steel demand being steady, one factor which investors are eyeing on is Chinaâs domestic steel output and consumption. As in the absence of high consumption in the domestic market, Chinaâs high steel output is likely to hit the global market and build an oversupply chain.
 The Major iron ore producers such as BSL, etc. are ramping up the production to take advantage of high iron ore and steel prices, and Valeâs absence in the market.
How is the Iron Ore Miner BlueScope reacting on Charts?
BlueScope Steel Limited (ASX:BSL) is moving in an uptrend for now from the level of A$12.880 (dayâs low on 25th February 2019). The share prices rose from the same level to A$14.370 (dayâs high on 7th March) before correcting to the level of A$13.360.
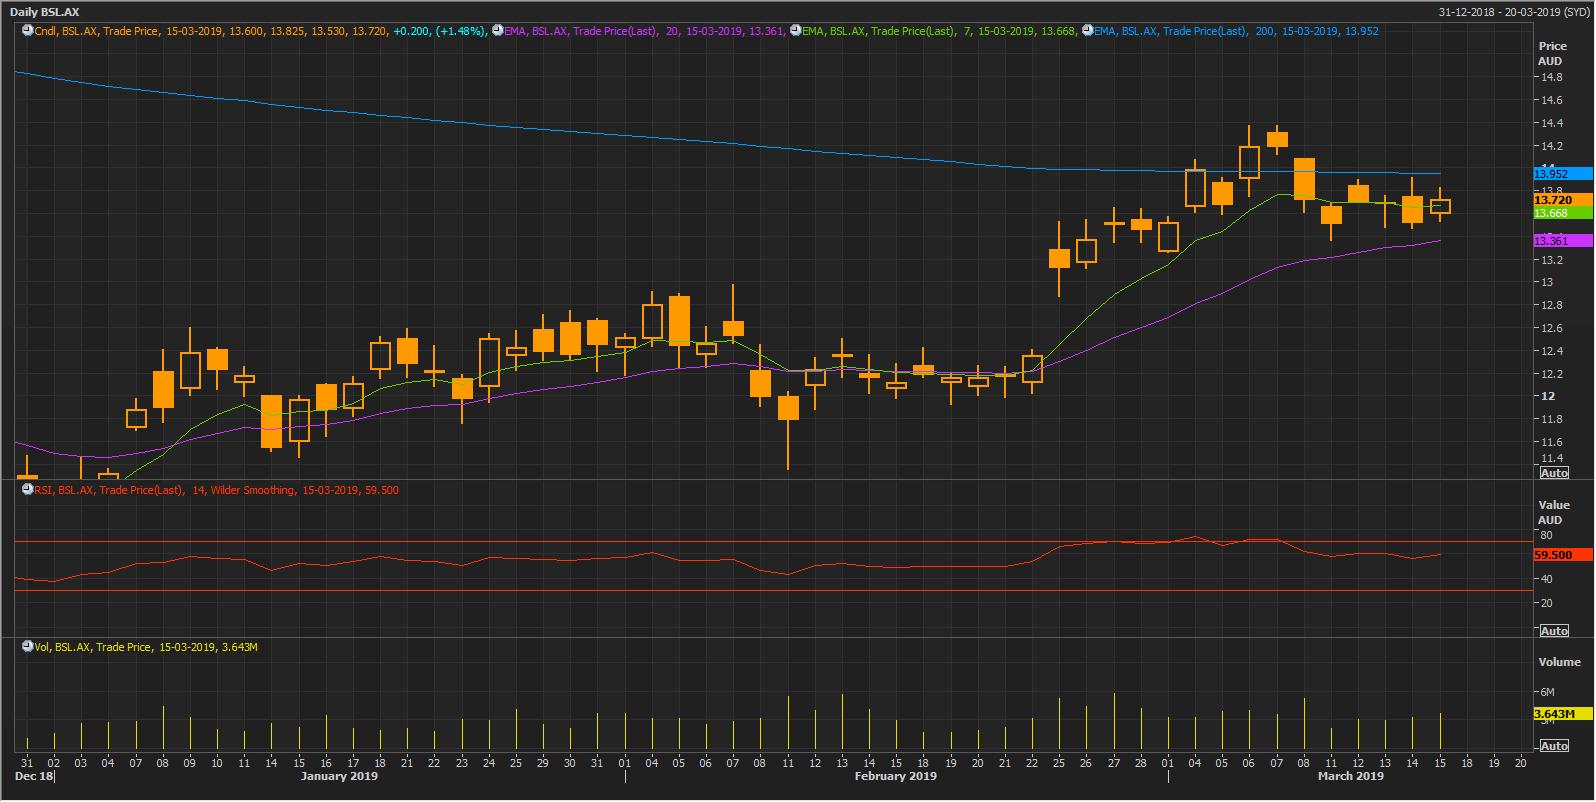
Source: Thomson Reuters (BSL Daily Chart)
Following the developments on daily charts, the share prices are trading below the 200-day exponential moving average (EMA), which is valued at A$13.95. The short term 7-days EMA is trading above the medium term 20-days EMA, which is supporting the prices over on the current scenario. The 7-days EMA is valued at A$13.668, and 20-days EMA is valued at A$13.361. The Relative strength index (14) is valued at 59.50. The prices are forming a Head & Shoulder (trend-reversal) pattern on the daily chart and is something to look forward as the pattern is followed by an uptrend. The Head & Shoulder is a reliable trend reversal pattern, and its significance improves if it is followed by an uptrend.
Disclaimer
This website is a service of Kalkine Media Pty. Ltd. A.C.N. 629 651 672. The website has been prepared for informational purposes only and is not intended to be used as a complete source of information on any particular company. Kalkine Media does not in any way endorse or recommend individuals, products or services that may be discussed on this site. Our publications are NOT a solicitation or recommendation to buy, sell or hold. We are neither licensed nor qualified to provide investment advice.
