


The key factor that drives price performance is demand and supply. If the demand of a stock increases and supply decreases, the prices rise and if the demand decreases and supply increases, prices fall. The relationship between demand and supply is very sensitive to the news flow at the moment. Normally, bad news has led investors to sell stocks and thus creating an increase in supply and decrease in demand. This triggers prices to fall. The opposite happens, when there is good news in the market.
In this article, we will see the effects of news on the prices of stocks.
Cedar Woods Properties Limited (ASX: CWP)
Cedar Woods Properties Limited is a national developer of residential communities and commercial properties. The company is one of the country’s leading developers.
The Company Reports Half Year Profit in Line with Guidance
The company reported a net profit after tax for 1HFY20 of $10.2 million in line with guidance of first half earnings being lower than in the previous year, with full year earnings weighted to the second half. The company has declared a fully franked interim dividend of 12.5 cents per share. The company’s balance sheet remains robust with net bank debt-to-equity of 38 per cent as at 31 December 2019. First half NPAT of $10.2 million was lower than the previous corresponding period (pcp), with first half revenue of $128.8 million, down 37 per cent on pcp, reflecting the weighting of project stage delivery to the second half of the year.
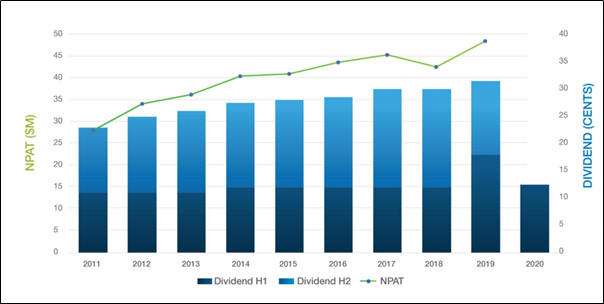
Past Performance (Source: Company’s Report)
Stock Performance
The stock of CWP is trading at $8.000 per share on 20th February 2020 (AEDT 10:44 AM), down by 2.32% from its previous closing price. The company has a market capitalisation of $658.87 million as on 20th February 2020. The total outstanding shares of the company stood at 80.45 million, and its 52-week low and high are $4.900 and $8.660, respectively. The stock of the company has given a total return of 9.49% and 25.04% in the time period of 3 months and 6 months, respectively.
APN Industria REIT (ASX: ADI)
APN Industria REIT is a listed Australian REIT owning interests in industrial and office properties that provide affordable and functional workspaces for businesses.
Results for the period ending 31 December 2019
For the six months ending 31 December 2019, the company reported profit of $39.3 million up $24.7 million on the prior corresponding period. FFO per security rose 8.5% to 10.2 cents and the upgraded FY20 FFO guidance of 19.9 cents per security is reaffirmed.
Other key highlights:
- The company completed 29 leases across ~7,000 square metres;
- It raised $46.9 million of equity and reduced gearing to 28.8%;
- The company settled acquisitions worth $57.1 million at an average cap rate of 7.0%;
- It will provide a combination of income security and value-add opportunities;
- Distribution paid at 8.75 cents per security up 2.9% and is on-track to deliver upgraded FY20 FFO guidance of ~3.5% growth per security.
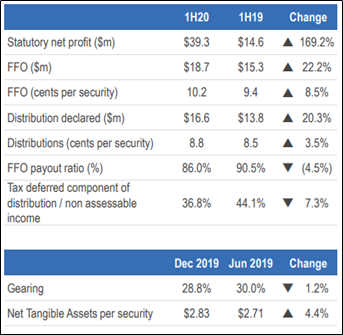
Financial Highlights (Source: Company Reports)
Stock Performance
The stock of ADI is trading at $3.170 per share on 20th February 2020 (AEDT 10:44 AM), flat against its previous closing price. The company has a market capitalisation of $626.49 million as on 20th February 2020. The total outstanding shares of the company stood at 197.63 million, and its 52-week low and high are $2.670 and $3.220, respectively. The stock has given a total return of 6.73% and 9.69% in the time period of 3 months and 6 months, respectively.
Stockland (ASX: SGP)
Stockland was founded in 1952 and has expanded to become one of Australia’s largest diversified property groups – developing, owning and managing a large range of residential, shopping centres, workplaces, communities and logistic assets and retirement living villages.
Stockland Results In-Line with Guidance
In 1h FY20, the company reported statutory profit of $504 million, up 68.1% on 1HFY19. FFO was down 5.6 per cent to $384 million and FFO per security was 16.1 cents. Statutory profit was up 68.1 per cent, primarily reflecting $199 million of positive net revaluations.
Other key highlights:
- Adjusted funds from operations (AFFO) stood at $338 million, down 4.2% on 1HFY19;
- AFFO per security was down by 2.7% to 14.2 cents, compared to 1HFY19;
- Net tangible assets (NTA) per security of $4.12, up from $4.04 at 30 June 2019;
- The company declared dividend of 13.5 cents per share, at distribution payout ratio of 84%.
The company has reiterated its FY20 FFO guidance of 37.4 cents per security and distribution per security of 27.6 cents, with distribution payout at the lower end of the company’s 75-85 per cent target ratio.
Stock Performance
The stock of SGP is trading at $5.270 per share on 20th February 2020 (AEDT 10:44 AM), up by 1.541% from its previous closing price. The company has a market capitalisation of $12.37 billion as on 20th February 2020. The total outstanding shares of the company stood at 2.38 billion, and its 52-week low and high are $3.420 and $5.310, respectively. The stock of the company has given a total return of 3.24% and 14.35% in the time period of 3 months and 6 months, respectively.
Charter Hall Group (ASX: CHC)
Charter Hall Group is Australia’s leading fully integrated property groups with over 29 years of experience. The company uses its property knowledge to deploy, access, invest and manage equity across industrial, office, retail and social infrastructure, which are the core operational sectors of the company.
The Company Reports Stellar Growth in Operating Earnings
The company announced its 1H FY20 results for the period ending 31 December 2019. Key financial and operational highlights for the period are:
- Operating earnings stood at $225.8 million, up 110% on the prior corresponding period;
- Statutory profit stood at $313.2 million, after tax attributable to stapled securityholders, up 235% on pcp;
- The company raised $3.0 billion of gross equity and $2.9 billion of net inflows generated for the 6-month period;
The company had given FY20 guidance for post-tax operating earnings per security (OEPS) growth of approximately 30% over FY19. The guidance is upgraded to approximately 40% OEPS growth per security on FY19. FY20 distribution per security guidance is for 6% growth over FY19.
Stock Performance
The stock of CHC is trading at $14.155 per share on 20th February 2020 (AEDT 10:44AM), up by 0.891% from its previous closing price. The company has a market capitalisation of $6.53 billion as on 20th February 2020. The total outstanding shares of the company stood at 465.78 million, and its 52-week low and high are $8.570 and $14.395, respectively. The stock of the company has given a total return of 28.83% and 16.72% in the time period of 3 months and 6 months, respectively.
Vicinity Centres (ASX: VCX)
Vicinity Centres is engaged in the business of property management, property investment, property development, funds management and leasing.
The Company Reports Solid First Half Results
For the six months ending 31 December 2019 (1H FY20), the company reported statutory net profit after tax of $242.8 million. FFO for the period was $337.0 million or 8.95 cents on a per security basis. The FY20 interim distribution was 7.70 cents per security, reflecting an AFFO payout ratio of 94.9%, which will be paid to securityholders on 2 March 2020.
Financial Highlights (Source: Company Reports)
Stock Performance
The stock of VCX is trading at $2.365 per share on 20th February 2020 (AEDT 10:44 AM), up by 0.212% from its previous closing price. The company has a market capitalisation of $8.87 billion as on 20th February 2020. The total outstanding shares of the company stood at 3.76 billion, and its 52-week low and high are $2.340 and $2.720, respectively. The stock of the company has given a total return of -12.27% and -4.45% in the time period of 3 months and 6 months, respectively.
