


Dow Jones Industrial Average (or DJI) is gaining momentum in the market after rebounding from its near-term support levels. Apart from Dow Jones, many other indices such as Nasdaq, FTSE 100 are also showing some promising recovery with prices testing and breaching important resistance levels.
To Know More, Do Read: S&P 500 and Dow Jones Poised for More Losses? Gauging Future Movement Via Technical Tools
- Dow Jones On a Daily Chart
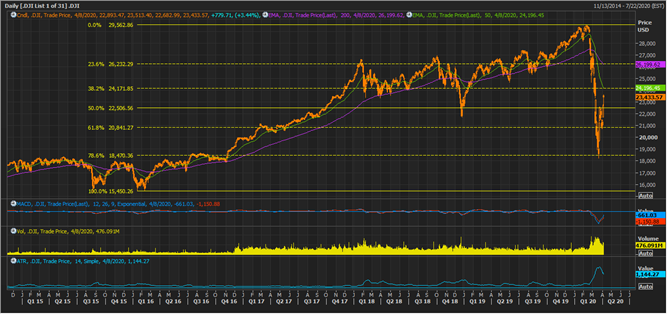
Dow Jones Industrial Average Daily Chart (Source: Thomson Reuters)
On the daily chart, it could be seen that the index has retraced over 78.6 per cent of the primary uptrend and is currently trading below the 200-day and 50-day exponential moving averages. However, the moving average convergence and divergence or MACD indicator is giving a positive signal.
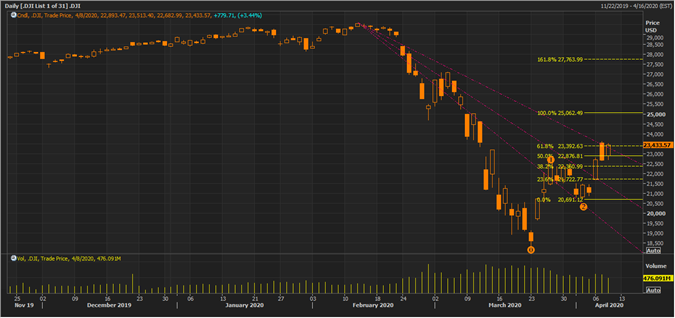
Dow Jones Industrial Average Daily Chart (Source: Thomson Reuters)
On further following the recent price action, it could be seen that the index has successfully tested the 1/3 fraction of the Fibonacci resistance fan, projected post connecting the recent high with the recent low. The steady build-up across the volume coupled with higher average true range (refer above chart) suggests strong momentum in the current recovery.
The ATR is currently valued at 1,144.27 suggesting that the index can show an overall move of 1,144 points during a session, either up, down, or both.
The index could now further test the 100.0 per cent projected level of the Fibonacci series, projected by connecting the wave points marked as 0,1, and 2. As per the classical theory of technical analysis, the 100.0 per cent resistance zone holds higher consideration, and a break above the same with good volume could serve as an early sign of a change in trend, while failure to do so could mark the continuation of the ongoing correction.
- Nasdaq On a Monthly Chart

Nasdaq on a Monthly Chart (Source: Thomson Reuters)
On the monthly chart, the index is trading in an uptrend and has successfully held the long-term upward sloping trendline. The index is yet trading above the 200-day and 50-day exponential moving average, with a slight negative signal from the MACD indicator.

Nasdaq on a Monthly Chart (Source: Thomson Reuters)
Further, it could be seen that the index has retraced almost 38.2 per cent during the recent correction; also the index held its 1/3 fraction of the Fibonacci support fan, projected from its initial rally point during the second quarter of the year 2009.
On the monthly timeframe, the support of the index is at the point marked as (2), and the major resistance for the uptrend continuation is at the point marked as (1). The index has just crossed the 38.2 per cent projected level of the Fibonacci series, projected from the wave point marked as 0,1, and 2, and look poised to further test multiple resistance levels.
- Nasdaq On a Weekly Chart

Nasdaq on a Weekly Chart (Source: Thomson Reuters)
On the weekly chart, it could be seen that the index has crossed the grey resistance zone, formed after Span A (or the mean value of the conversion line and the base line) crossed the Span B (which is the mean value of 52-week high and low) from down.
The recent price action in the index is also showing a slight positive crossover between the conversion line (dark blue) or the mean value of 9-week high and low, and the base line (pink line) or the mean value of 26-week high and low.
The 14-week Relative strength Index is following the recent recovery in price, suggesting a continuation of the primary trend.
- Nasdaq On a Daily Chart
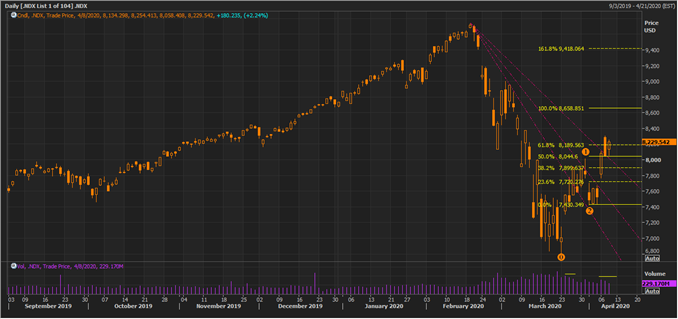
Nasdaq on a Daily Chart (Source: Thomson Reuters)
On the daily chart, it could be seen that the index has breached 1/3 fraction of the short-term Fibonacci resistance fan, projected by connecting the recent high to the recent low. The index has also crossed the all the projected resistance zones suggested by the Fibonacci fan with decent volume, suggesting that the rally now might test the 100.0 per cent projected level of the Fibonacci series, projecting by connecting the wave points marked as 0,1, and 2.
- FTSE 100 On a Monthly Chart
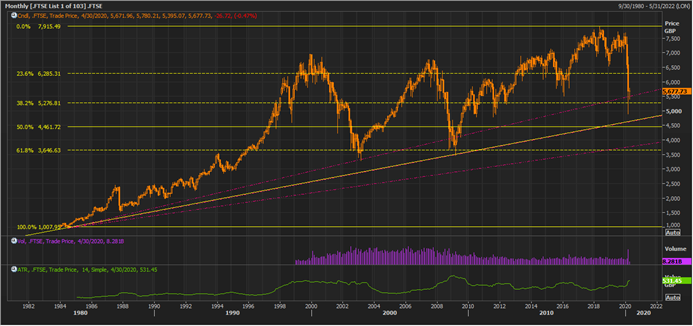
FTSE on a Monthly Chart (Source: Thomson Reuters)
On the monthly chart, we notice that the index has penetrated the projected Fibonacci support line; however, the index managed to recover and close above the support line during the last month. At present, the index is trying to recover from the support level. The slight rise in volume and high ATR suggest that the index is ready for a move of 531.45 points, either upside, downside, or sideways, and to assess the probability of the direction, let us shorten the time frame.
- FTSE 100 On a Weekly Chart
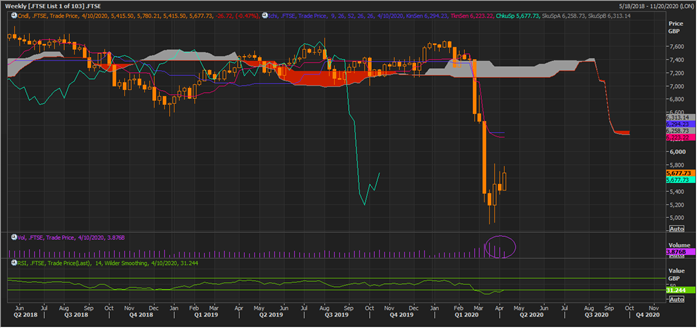
FTSE on a Weekly Chart (Source: Thomson Reuters).
On the weekly chart, the index is showing some recovery; however, it is yet to test and break the grey resistance zone. The gap between Span A and Span B is closing, suggesting a loss in downside momentum. The index is, however, rising on tapering volumes, and investors should monitor the suggested level closely. A break and sustain above the grey cloud zone would mark the continuation of the primary uptrend, and failure to do so would increase the probability of another correction.
- FTSE 100 On Daily Weekly Chart
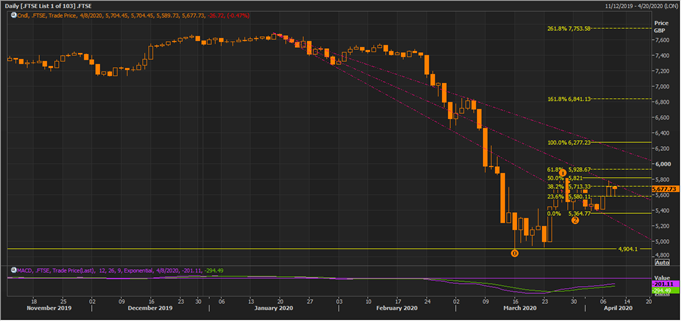
FTSE on a Daily Chart (Source: Thomson Reuters)
On the daily chart, the MACD indicator is giving a positive signal, while prices are trying to recover above the 2/3 fraction of the projected Fibonacci resistance fan. The primary resistance for the index would be the 1/3 fraction of the Fibonacci resistance fan followed by the 100.0 per cent of the Fibonacci series, projected from the wave point marked as 0,1, and 2.
