


The recovery in crude oil prices, which started over the anticipation of improvement in oil demand and various production cut instigated by OPEC+ and North America to curtail about 20 million barrels of oil production per day, seems to be now taking a breather with prices of Brent Crude Oil futures (CFD) recovering from the level of USD 15.98 per barrel (intraday low on 22 April) to reach a high of USD 32.27 per barrel on 6 May 2020, which marked a recovery of ~ 101.9 per cent.
To Know More, Do Read: Crude Soars on Slightest Indication of Demand; Oil is not out of the Woods yet
However, post trading for about a week in positive territory, crude oil now seems to have taken a ground around the same level with prices now hovering around USD 30 to USD 29 per barrel and facing resistance.
Crude oil on Charts
- Crude Oil on A Monthly Chart
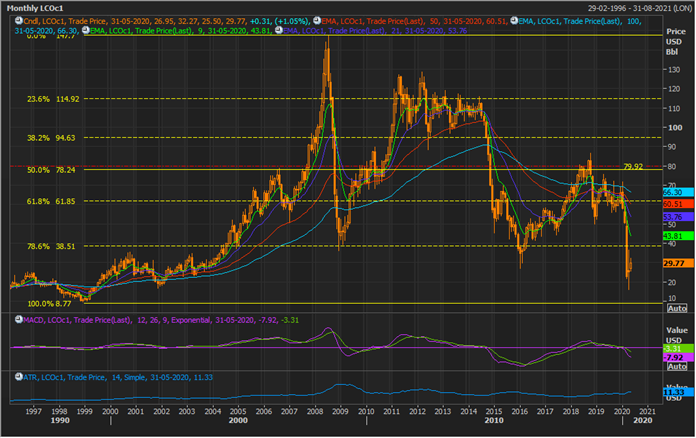
LCO Monthly Chart (Source: EODHD/Others Thomson Reuters)
On the monthly chart, crude has retraced over 78.6 per cent of the primary up-rally which started from the level of ~ USD 8.77 and peaked ~ 147.7 per barrel. Currently, the 12,26,9 MACD or moving average convergence and divergence indicator is giving a negative signal while prices are trading below the pair of short-term (9,21) and medium-term (50,100) exponential moving averages.
The pair of 9- and 21-month exponential moving average is trading below the medium-term pair of 50- and 100-month exponential moving averages, which coupled with a negative signal from MACD and falling downward sloping Average True Range or ATR is suggesting that bears currently dominate the market.
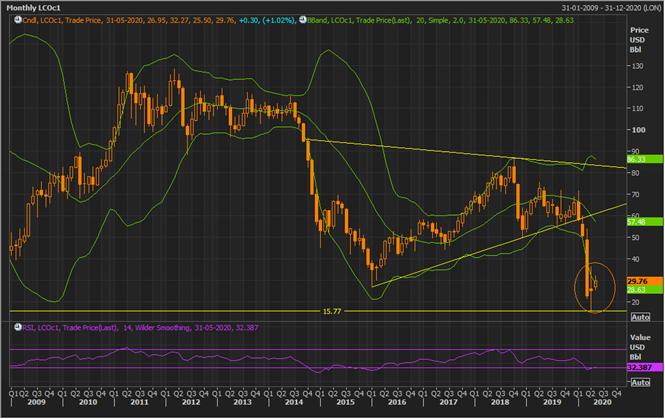
LCO Monthly Chart (Source: EODHD/Others Thomson Reuters)
On further analysing the monthly chart, it could be seen that crude oil prices demonstrated a spinning top candle in a downtrend on a monthly timeframe, which could be an early signal that bears might be losing reins; however, to confirm that the commodity has to cross the high of the spinning top, and if prices breach the high of the spinning top and sustain with decent volume, bulls could take charge ahead.
On applying the 14-month Bollinger band, it could be seen that prices have squeezed or have shown low momentum before showing a large divergence against the mean value, expanding +-1 standard deviation. Presently, the commodity is trading around the -1 standard deviation, and as per the technical theory of technical analysis, post reaching near +- standard deviation from the mean value, prices usually retrace towards the mean.
However, currently, the 14-month Relative Strength Index is below the mean value, but is above its oversold zone, reflecting that the market awaits further development in the oil space in terms of both demand and supply.
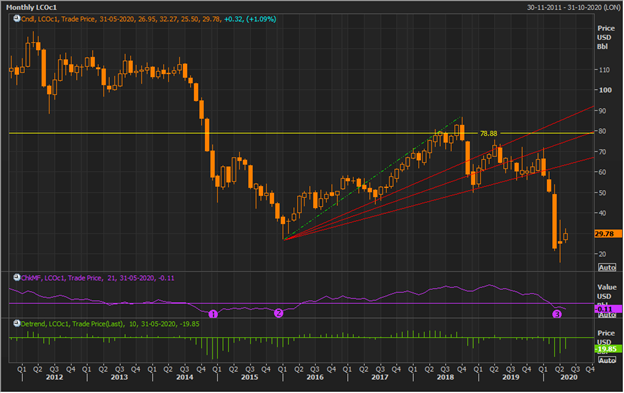
LCO Monthly Chart (Source: EODHD/Others Thomson Reuters)
On applying Detrend and Money Flow Index on the monthly chart, it should be noticed that the Money Flow Index is showing a slight variation with the price behaviour, and while the commodity is making newer lows, the money flow is showing a positive bias.
The Detrend Price Oscillator is also showing variation with the price behaviour, and while during the first quarter of the year 2015, the indicator has touched a bottom, prices remained relatively higher, and currently, while the price is near the recent bottom, the indicator is above its historic bottom seen in Q1CY2015.
The variation in both indicators as compared to the price behaviour suggests that crude oil could show a momentum ahead; however, it would be hard to assess the direction of it.
However, monthly charts above suggest that the price is near the -1 standard deviation from the mean, which coupled with the momentum signals from Money Flow and Detrend suggests that the price might attempt to cross the high of the spinning top.
- Crude Oil on A Weekly Chart
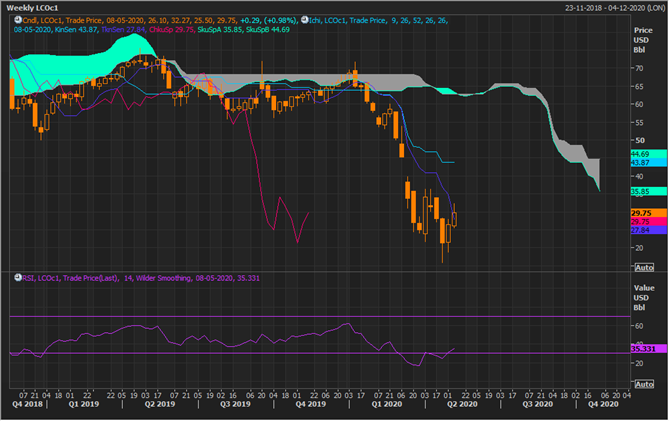
LCO Weekly Chart (Source: EODHD/Others Thomson Reuters)
On the weekly chart, crude oil is trading below Span A or the mean value of the conversion line (dark blue) and the base line (sky blue); and,
- The conversion line, which represents the mean value of 9-week high and low, is showing a negative cross with the base line, which represents the mean value of 26-week high and low; and,
- The spread between Span A and Span B, which is the mean value of 52-week high and low is enlarging, suggesting that the current trend is a downtrend.
However, in the status quo, crude oil has moved above the value of the conversion line, suggesting that bulls are entering the market, but the trend ahead would be largely determined by the result of bears sentiment, which according to the technical theory of Ichimoku cloud, would change if the price breach and sustain above the grey cloud area or the point where Span A has crossed Span B towards the downside.
The 14-week Relative Strength Index is moving in tandem with the recent price behaviour is currently above the oversold zone and below the mean.

LCO Weekly Chart (Source: EODHD/Others Thomson Reuters)
On the weekly timeframe, the MACD indicator is showing a negative signal while the commodity is testing its downward sloping resistance while taking the support of -1 standard deviation of the Bollinger band.
- Crude Oil on A Daily Chart
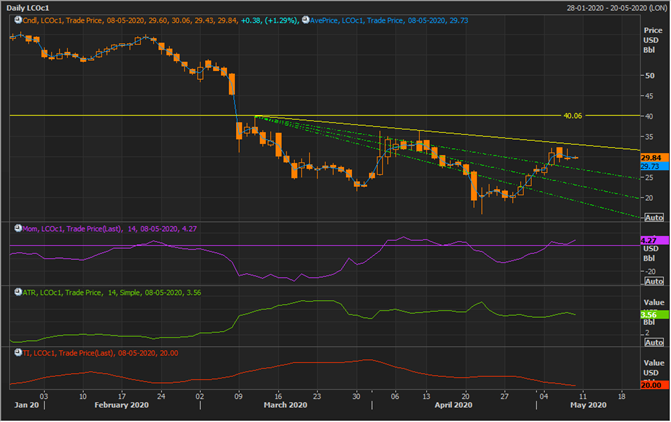
LCO Daily Chart (Source: EODHD/Others Thomson Reuters)
On the daily chart, it could be seen that prices are now facing resistance around the level of the downward sloping short-term trendline and is currently hovering above the average price indicator. Also, the trend-based indicators are showing mixed signal on the daily timeframe with momentum indicator (mom) showing an upward slope, while trend intensity (or TI) indicator is showing a downside slope.
On projecting the Fibonacci fan by connecting recent high to the recent, the near-term support (green lines) for oil prices could be seen.
