


Iron ore prices are climbing up on the charts post the policy changes in China to support the infrastructure. The prices of iron ore futures (Jan 2020) on the Dalian Commodity Exchange surged from RMB 587.0 (low on 11 November 2019) to the present high of RMB 645.0 (as on 20 November 2019 5:15 PM AEST).
To know what supported the iron ore prices in the international market, Do Read: Chinaâs Push for Infrastructure and High Steel Margins Propels ASX Iron Ore Miners
What to Expect from Iron Ore Ahead?
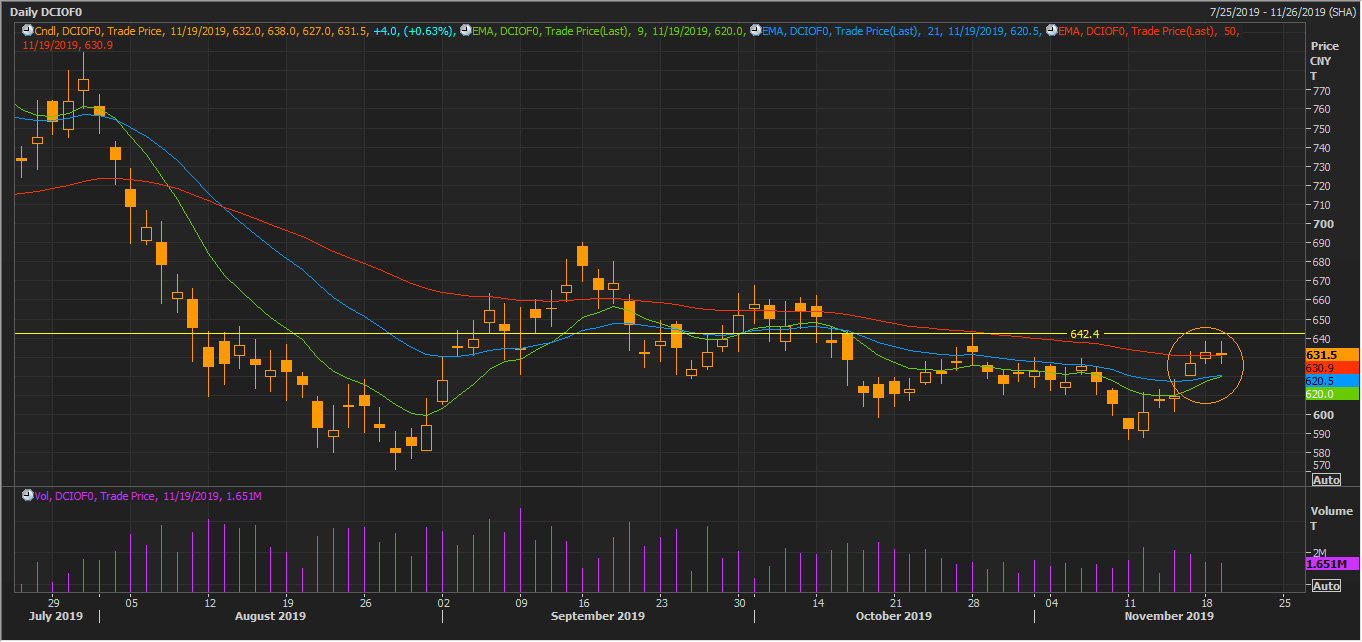
DCIOF0 Daily Chart (Source: Thomson Reuters)
On the daily chart, the iron ore prices are trading around the crucial resistance level of RMB 642.4 and above the 50-, 21- and 9-days exponential moving averages. The moving averages could now act as the support for the iron ore prices, and if the prices breach below the EMAs, they could act as the resistance; however, investors should keep a margin of 0.5 to 1 per cent, as the volume trend suggests that the price might form a trend reversal pattern, which, if unfolds would be covered in the scope of our next article.

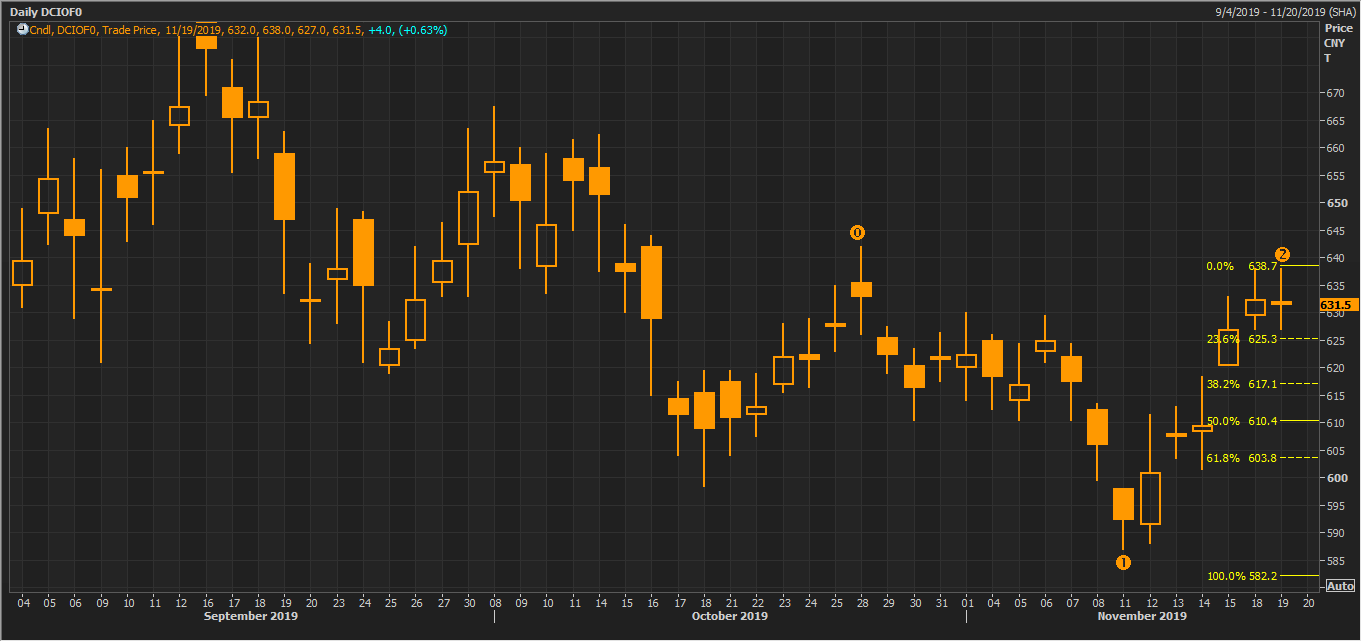
DCIOF0 Daily Chart (Source: Thomson Reuters)
On further analysing the daily chart, we could witness two Doji candles, which, coupled with an increase in volume suggest a deep hand-on-hand between the bulls and bears. The tug-of-war between the bulls and bears are currently supporting the bulls, which in turn, further support the indication of a possible trend reversal; however, there is no definite signal at the current moment.
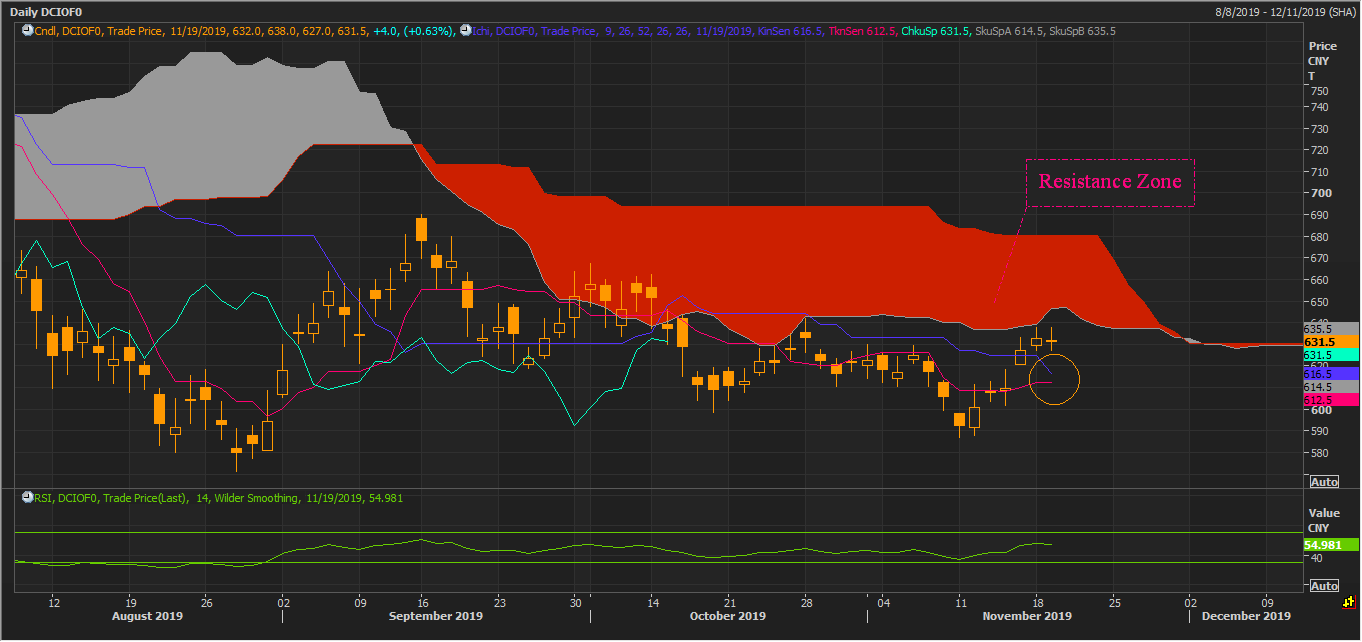
DCIOF0 Daily Chart (Source: Thomson Reuters)
On applying the Ichimoku studies on the daily chart, we could witness that the prices are currently taking the hurdle of the red cloud, formed after Span A (the mean of the conversion line and the base line) went below Span B (the mean of 26-day highs and lows).
The prices are trading below the Span A; however, the conversion line (the mean of 9-day highs and lows) (pink line) is below the base line (the mean of 26-day highs and lows) (navy blue), and if the prices continue the existing uptrend, it might lead to a positive crossover, otherwise the prices could take the hurdle of the red cloud and retrace back downwards.
The 14-day Relative Strength Index is currently in line with the rising prices and trading above the mean value of 50 at 54.98.
The current trend and the tug-of-war between the bulls and the bears could either support the prices or put pressure on it, and would depend upon the further price trading patterns; However, the projections of both the cases are as below:
Bearish Case
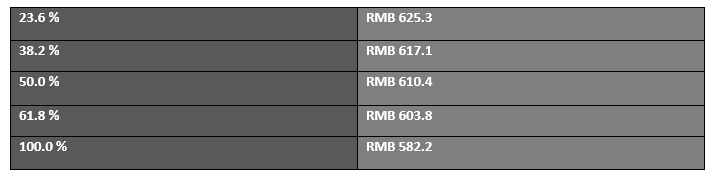
For the bearish scenario, the downside Fibonacci projections are as below:
DCIOF0 Daily Chart (Source: Thomson Reuters)
Bullish Case
For the bullish case, the upside Fibonacci projections are as below:
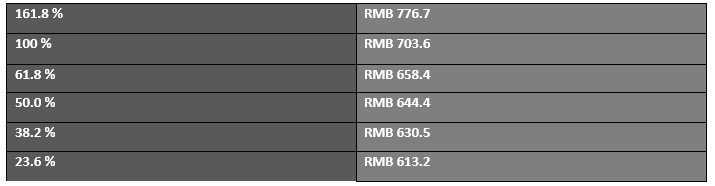

DCIOF0 Daily Chart (Source: Thomson Reuters)
While the iron ore prices are trading in the doldrums and the tug-of-war between the bulls and bears is going on, gold Spot continues the deep consolidation; however, the trendlines of the consolidation range is narrowing down.
Is Gold Consolidation Nearing to an End?
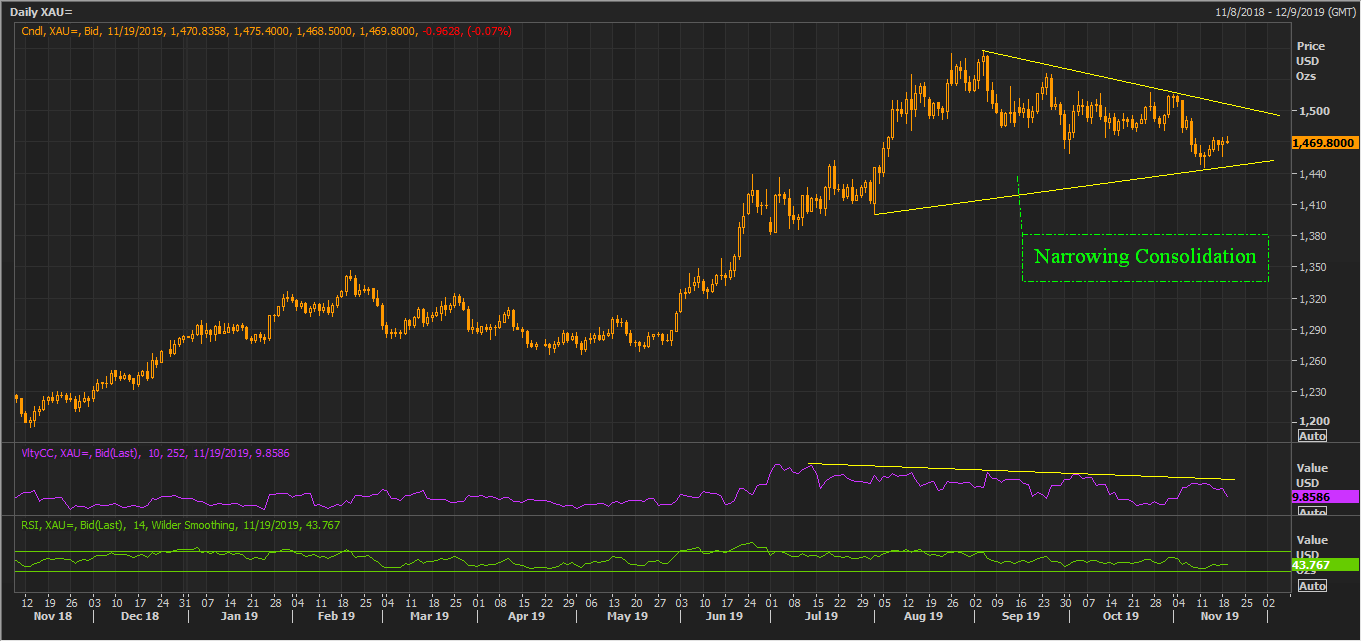
XAU Daily Chart (Source: Thomson Reuters)
On the daily chart, the gold spot prices are moving in a deep consolidation; however, the trendlines of the consolidation range is now narrowing, which in turn, suggests that gold is getting ready for a significant move.
The demand for gold in the third quarter remained high against the previous corresponding period, and global clues are also favouring gold against bonds and risky assets for better portfolio diversification.
To Know More, Do Read: Does Gold Investing Intimidate you? Discover the Right Parameters for Astute Judgement
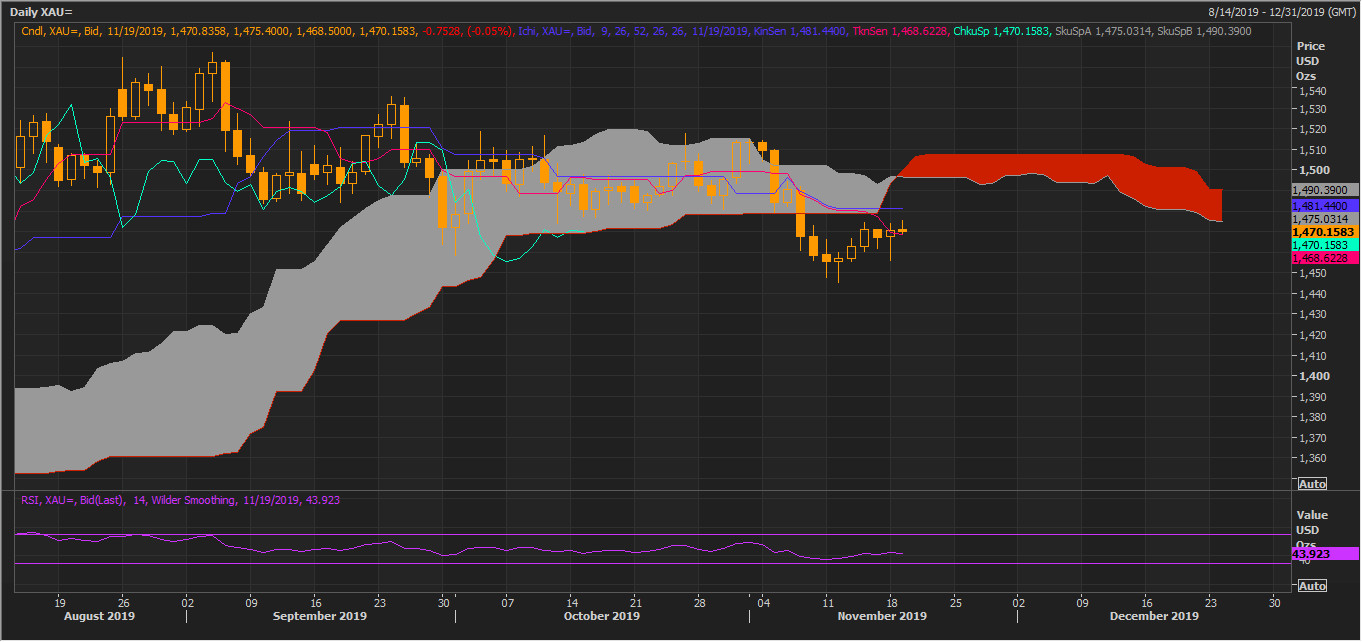
XAU Daily Chart (Source: Thomson Reuters)
Post applying the Ichimoku technique on the daily chart, we could observe that the gold prices are currently trading at the resistance cloud (grey) formed after Span A moved above the Span B. The conversion line (pink line) is below the base line (navy blue).
For now, gold price actions are not showing any vow signs; however, the consolidation range is narrowing down, which is indicating a trend might soon establish in gold.
Also Read: An Investorsâ Guide for Commodity Valuation and Mining Stocks
Now that the behaviour of iron ore and gold in the global market is clear, the investors should analyse the scenario further to dive in the market; however, it would be wise to get acquainted with the methods of jumping into the commodity market.
To know more, which route to park your investment into the commodity market would be better, Do Read: Gold-Backed ETFs Vs Gold; A look At Direct And Indirect Investment Approach
How is the Gold Sector Looking in Australia?
The rally in the gold prices had fanned the ASX listed gold stocks, and gold stocks even emerged as the top-performing mining stocks until recently. However, the consolidation in gold along with various operational discrepancies have exerted pressure on some of the gold stocks such as Resolute Mining Limited (ASX: RSG), Saracen Mineral Holdings Limited (ASX: SAR), etc.
To Know More, Do Read: A Glimpse Over ASX-Listed Top Performing Mining Stocks
In the status quo, the gold stocks are again gaining momentum in Australia amid recent ramp up by the gold miners to take advantage of the prevailing gold prices in the international market. The Department of Industry, Innovation and Science has anticipated a higher export of gold over the years ahead, amid large production capacity of the miners.
To Know More, Do Read: ASX Gold Stocks At The Brim Of The Rejuvenating Gold Industry In Australia
On further touching upon gold, albeit, the subject matter experts believe that the gold still got some steam left, however, few industry experts such as JP Morgan, believe that the gold consolidation could stay for a while, and the investment banking major even anticipates the prices to average around USD 1,500 per ounce in the current year.
Disclaimer
This website is a service of Kalkine Media Pty. Ltd. A.C.N. 629 651 672. The website has been prepared for informational purposes only and is not intended to be used as a complete source of information on any particular company. Kalkine Media does not in any way endorse or recommend individuals, products or services that may be discussed on this site. Our publications are NOT a solicitation or recommendation to buy, sell or hold. We are neither licensed nor qualified to provide investment advice.
