


Highlights:
- United Parcel Service, Inc. (NYSE:UPS) revenue rose 15% YoY in fiscal 2021.
- Union Pacific Corporation (NYSE:UNP) will report its first-quarter fiscal 2022 financial results on April 21,
- Raytheon Technologies Corporation (NYSE:RTX) expects its sales to be between US$68.5 and US$69.5 billion in fiscal 2022.
The industrial sector is considered the backbone of the economy. The sector comprises some of the oldest and most popular companies in the US. These companies are engaged in manufacturing heavy industrial machinery for the construction and manufacturing industries.
Although the industrial sub-sectors tend to perform differently, the overall segment generally moves according to the performance of the economy. Currently, the sector has been in focus as the economy recovers from the pandemic disruptions. The following are some of the top S&P 500 industrial stocks worth exploring in the second quarter.
Also Read: What is Moonbeam (GLMR) crypto? Everything you need to know
United Parcel Service, Inc. (NYSE:UPS)
United Parcel Service is a package delivery company based in Atlanta, Georgia. It primarily focuses on the shipping and receiving packages and provides supply management services globally.
The shares of the company traded at US$204.98 at 12:14 pm ET on April 4, up 0.80% from their closing price of April 1. Its stock value decreased by 3.21% YTD.
The firm has a market cap of US$178.57 billion, a P/E ratio of 13.96, and a forward one-year P/E ratio of 16.13. Its EPS is US$14.69.
The 52-week highest and lowest stock prices were US$233.72 and US$171.11, respectively. Its trading volume was 3,993,556 on April 1.
The company's consolidated revenue grew 11.5% YoY to US$27.8 billion in Q4, FY21, while its net income came in at US$3.09 billion, or US$3.52 per diluted share. For fiscal 2021, the company's revenue surged 15% YoY to US$97.3 billion.
Also Read: Why PLC Ultima (PLCU) crypto skyrocketed nearly 300% YTD?
 Source: Pixabay
Union Pacific Corporation (NYSE:UNP)
Union Pacific Corp is one of the leading transportation and railroad operating firms that manages its operations through its principal subsidiary Union Pacific Railroad Company. It is based in Omaha, Nebraska.
The stock of the company traded at US$256.14 at 12:24 pm ET on April 4, down 1.47% from its previous closing price. The UNP stock rose 4.92% YTD.
The market cap of the company is US$161.21 billion, the P/E ratio is 25.78, and the forward one-year P/E ratio is 22.55. Its EPS is US$9.95.
The stock saw the highest price of US$278.94 and the lowest price of US$195.68 in the last 52 weeks. Its share volume on April 1 was 6,366,997.
The company will report its first-quarter fiscal 2022 financial results on April 21, 2022.
Meanwhile, in the fourth quarter of fiscal 2021, the company's operating revenue increased by 12% YoY to US$5.73 billion, while its net income came in at US$1.71 billion, or US$2.66 per diluted share. For fiscal 2021, the company's operating revenue rose 12% YoY to US$21.80 billion.
Also Read: Lytus IPO: When is this IT services provider going public?
Raytheon Technologies Corporation (NYSE:RTX)
Raytheon Technologies is one of the leading aerospace and defense firms based in Waltham, Massachusetts. It provides a range of services in aerospace, intelligence services, defense, and other related fields.
The shares of the company traded at US$99.19 at 12:35 pm ET on April 4, down by 0.98% from their closing price of April 1. Its stock value increased by 15.18% YTD.
The firm has a market cap of US$147.53 billion, a P/E ratio of 38.52, and a forward one-year P/E ratio of 20.91. Its EPS is US$2.57.
The 52-week highest and lowest stock prices were US$104.34 and US$76.07, respectively. Its trading volume was 3,608,615 on April 1.
The company's fourth-quarter sales were US$17.04 billion, up 4% YoY, while its net income came in at US$685 million, or US$0.46 per share. For fiscal 2021, the company's sales rose 14% YoY to US$64.4 billion.
The company now expects its sales to be between US$68.5 and US$69.5 billion in fiscal 2022.
Also Read: What is MarketMove (MOVE) crypto? Five things to know
Honeywell International Inc. (NASDAQ:HON)
Honeywell International is a technology-based industrial firm that offers a range of technology solutions to its clients. It primarily has four operating segments, which are aerospace, building technologies, performance materials and technologies, and safety product solutions. The firm is based in Charlotte, North Carolina.
The stock of the company traded at US$195.10 at 12:43 pm ET on April 4, down 0.47% from its previous closing price. The HON stock fell 5.21% YTD.
The market cap of the company is US$133.94 billion, the P/E ratio is 24.67, and the forward one-year P/E ratio is 22.85. Its EPS is US$7.92.
The stock saw the highest price of US$236.86 and the lowest price of US$174.42 in the last 52 weeks. Its share volume on April 1 was 2,286,690.
The company's sales were US$8.7 billion in Q4, FY21, while its net income came in at US$1.44 billion, or US$2.05 per diluted share. For fiscal 2021, the company's net sales were US$34.39 billion.
For fiscal 2022, the company expects its sales to be between US$35.4 billion and US$36.4 billion.
Also Read: What is Sologenic (SOLO) crypto? Know price and performance
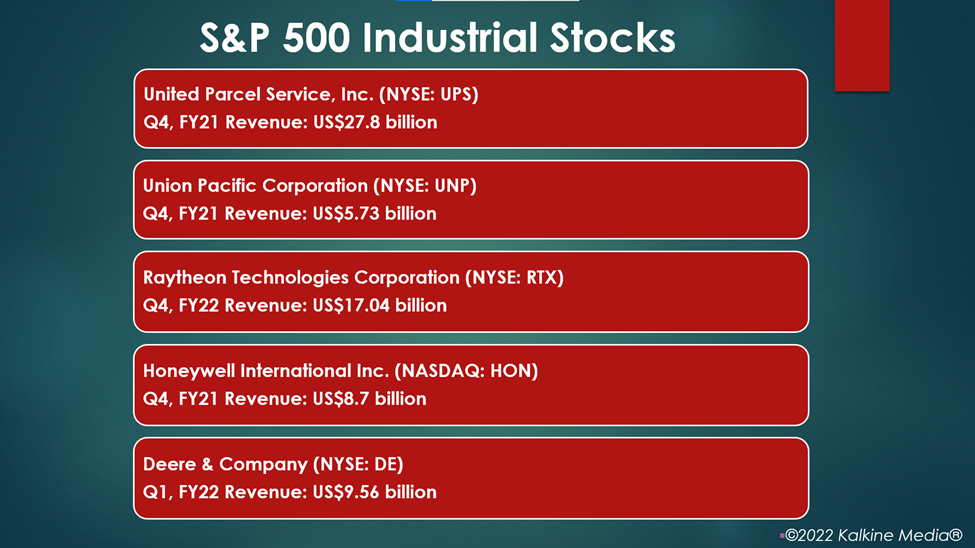
Deere & Company (NYSE:DE)
Deere & Company is focused on manufacturing agricultural machinery, heavy equipment, diesel engines, drivetrains, and other related products. It is based in Moline, Illinois.
The shares of the company traded at US$415.35 at 12:49 pm ET on April 4, down 0.35% from their closing price of April 1. Its stock value soared 19.05% YTD.
The firm has a market cap of US$127.76 billion, a P/E ratio of 23.09, and a forward one-year P/E ratio of 18.34. Its EPS is US$18.04.
The 52-week highest and lowest stock prices were US$437.98 and US$320.50, respectively. Its trading volume was 1,480,945 on April 1.
The company's net sales and revenue rose 5% YoY to US$9.56 billion in Q1, FY22, while its net income came in at US$903 million, or US$2.92 per diluted share.
Also Read: Why is STEPN (GMT) crypto gaining attention?
Bottom line:
The S&P 500 industrial index was up 3.48% over the past year, but it declined 3.42% YTD. The US market has been choppy amid spiraling high inflation and supply concerns this year.
The Russia-Ukraine war has caused further supply disruptions, pushing the prices of essential commodities even higher. Hence, investors should exercise due diligence before shopping in the equity market.
