


Highlights
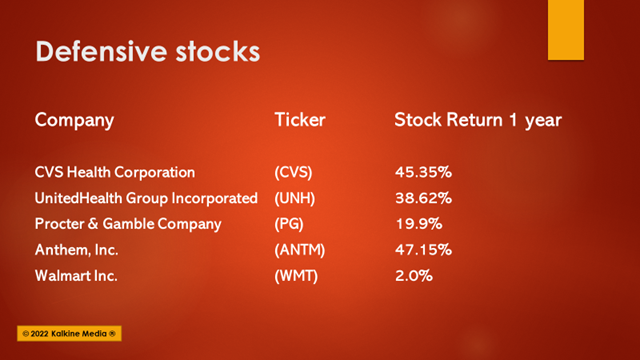
- CVS Health Corporation (NYSE:CVS) stock generated a 45.35%-return in one year with an annualized dividend of US$2.20.
- UnitedHealth Group Incorporated (NYSE:UNH) stock rose 38.62% in one year; its annualized dividend is US$5.80.
- Anthem, Inc. (NYSE:ANTM) stock grew 47.15% in the last 12 months. Its annualized dividend is US$5.12.
While growth stocks generally produce good returns, they can falter in uncertain times.
Major geopolitical and economic turmoil may bring them down as rapidly as they go up.
On the other hand, defensive stocks are least affected by macroeconomic and external factors. They grow by acquiring companies and pay dividends to shareholders.
Their services are required at all times. Hence, they may be suitable for risk-averse investors looking for slow but stable income.
Here we discuss five defensive stocks that saw positive growth in one year.
Also Read: Top 5 gold stock picks for strategic inflation hedge: From GOLD to FNV
CVS Health Corporation (NYSE:CVS)
Market Cap: US$135.3 billion
Closing price on February 24: US$100.77
One year return: 45.35%
Woonsocket, Rhode Island-based CVS Health provides integrated healthcare services through local presence and digital channels. It has roughly 300,000 physicians, pharmacists, nurses, etc., in its membership network.
The company earned US$292.1 billion in revenue in the fiscal year ended December 31, 2021, an increase of 8.7% compared to the prior year.
Its net income grew US$706 million in FY2021 to US7.9 billion or US$5.95 per share diluted compared to the net income of US$7.19 billion or US$5.47 per share diluted in FY2020.
The company administered more than 32 million COVID-19 tests and over 59 million COVID-19 vaccines in 2021. Its cash and equivalents were US$9.4 billion as of December 31, 2021.
CVS’s current dividend yield is 2.15%, and its annualized dividend is US$2.20. The company has a forward P/E for one year of 12.20.
Its stock traded in the range of US$111.25 to US$68.02 in the last 52 weeks.
Also Read: BUD to STZ: 5 beer stocks to look for as Russia-Ukraine crisis mounts
Also Read: 5 ways you can avoid being duped by crypto scammers
UnitedHealth Group Incorporated (NYSE:UNH)
Market Cap: US$428 billion
Closing price on February 24: US$455.89
One year return: 38.62%
UnitedHealth Group is a private health insurer based in Minnetonka, Minnesota. It provides medical benefits to 50 million members worldwide. It has obtained scale in managed care through its employer-sponsored, self-directed, and government-backed insurance plans.
For the year ended December 2021, its revenue rose 12% YoY to US$287.6 billion. The net earnings attributable to common shareholders came in at US$17.28 billion compared to US$15.4 billion in FY 2020. The EPS diluted increased to US$18.08 against US$16.03 in 2020.
Its forward P/E ratio is 21.02, the dividend yield is 1.26%, and the annualized dividend is US$5.80. The UNH stock moved in the range of US $509.23 to US$326.04 in one year.
Also Read: Cyber stocks PANW, DDOG, 3 others to watch amid Russia-Ukraine crisis
Procter & Gamble Company (NYSE:PG)
Market Cap: US$374 billion
Closing price on February 24: US$151.76
One year return: 19.9%
Cincinnati, Ohio-based Procter & Gamble is more than a 150-year-old company. It is one of the largest consumer product manufacturers globally, generating more than US$75 billion in annual sales. Its main products are Tide, Pantene shampoo, Pampers diapers, among many others.
For the second quarter ended December 31, 2021, the company posted net sales of US$21 billion, a 6% increase compared to US$19.7 billion in the previous year's quarter.
The net income attributable to the company came in at US$4.22 billion compared to US$3.85 billion in Q2 of the prior year. Its EPS diluted increased by 13% to US$1.66 compared to US$1.47 in the previous year.
The company has a forward P/E ratio of 25.68. The dividend yield is 2.23%, with an annualized dividend of US$3.479. The stock moved in the range of US$165.35 to US$121.54 in 52 weeks.
Also Read: What is Libero Financial crypto?
Anthem, Inc. (NYSE:ANTM)
Market Cap: US$109 billion
Closing price on February 24: US$441.81
One year return: 47.15%
The health insurer provides medical benefits to roughly 45 million medical members in the US. Anthem's offerings include employer, individual, and government-sponsored insurance plans.
The company is based in Indianapolis, Indiana.
For the fiscal year ended December 31, 2021, its revenue increased by 13.8% YoY to US$138 billion. The net income increased by 33.5% to US$6.1 billion or US$24.73 per share diluted compared to US$4.57 billion or US$17.98 per share diluted in fiscal 2020.
It reported an increase of 303,000 members in medical enrollment to 45.4 million in Q4, 2021.
ANTM has a forward P/E for one year of 15.53. Its dividend ratio is 1.02%, with an annualized dividend of US$5.12. ANTM stock price moved in the range of US$472.01 to US$298.60 in the last 52 weeks.
Also Read: Shein IPO: Is the Chinese retail firm debuting in the US market?

Source: Pixabay
Also Read: What is OMI crypto? How its cash-for-gems feature works?
Walmart Inc. (NYSE:WMT)
Market Cap: US$428 billion
Closing price on February 24: US$134.53
One year return: 2%
Walmart is one of the world’s largest retailers. It operated around 11,400 stores at the end of fiscal 2021. It is based in Bentonville, Arkansas. It sells general merchandise and grocery items.
Its total revenue increased by 2.4% YoY to US$572.8 billion in fiscal 2022. Its net income came in at US$13.6 billion, a 1.2% increase YoY for FY2022. The GAAP EPS came in at US$4.87, and the adjusted earnings per share were US$6.46.
WMT has a forward P/E for one year of 19.87. Its dividend ratio is 1.63%, with an annualized dividend of US$2.24. Its stock traded in the range US$152.57 to US$126.28 in the last 52 weeks.
Bottomline
The Invesco Defensive Equity ETF (DEF) returned 15.45% gains in one year at the current price of US$66.7901 at 9:58 am ET on Friday. Although defensive stocks are relatively safer, they are not fully risk-free. Hence, investors should apply due diligence before investing in stocks.
