


Highlights
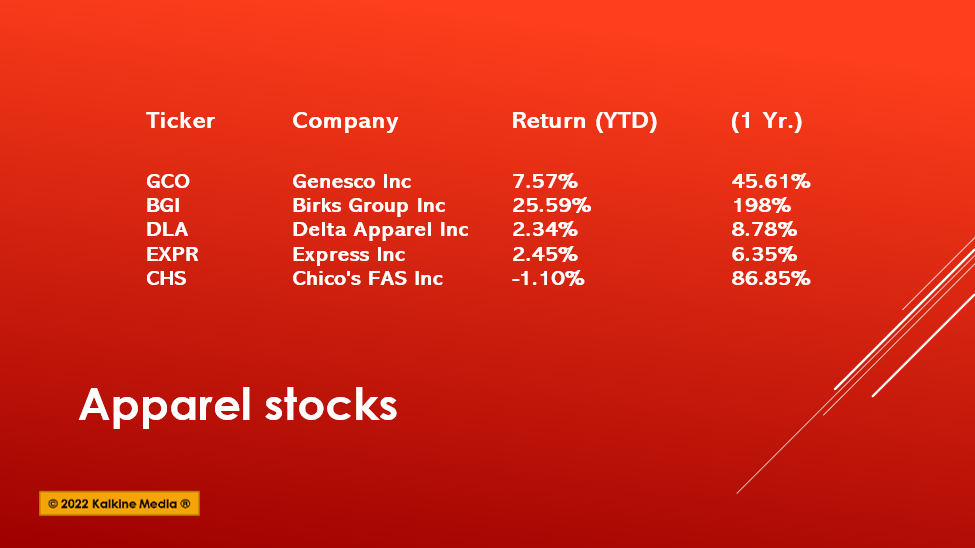
- Genesco Inc. (NYSE:GCO) has aP/E ratio of 8.54. The stock grew 45.61% in one year.
- Delta Apparel, Inc.'s (AMEX: DLA) P/E ratio is 9.63, and its one-year return is 8.78%.
- Chico's FAS, Inc. (NYSE:CHS) has a P/E ratio of 14.23, and its stock rose 86.85% in one year.
US retail sales picked up in March despite rising inflation. Spending on consumer discretionary segments, such as restaurants and apparel, saw a big jump as the health crisis improved.
Here we discuss five apparel stocks that gave positive returns in one year.
Genesco Inc. (NYSE:GCO)
Closing price on April 21, 2022: US$68.38
Nashville, Tennessee-based Genesco sells sports apparel, footwear, headwear, and accessories. Its four reportable segments are Journeys Group, Journeys Kidz & Little Burgundy retail footwear chains, e-commerce operations, and catalog.
For the fiscal year ended January 29, 2022, its net sales were US$2.42 billion, a 36% increase compared to US$1.79 billion in the previous fiscal year. Its net earnings came in at US$114.8 million or US$7.92 per diluted share compared to the net loss of US$56.43 million or US$3.97 per diluted share in the fiscal year 2020.
It reported its cash and cash equivalents of US$320.5 million as of January 29, 2022, versus US$215.1 million as of January 30, 2021.
The company has a market capitalization of US$933.9 million. Its P/E ratio is 8.54, and the forward P/E for one year is 9.23. The stock touched the highest at US$73.72 and the lowest price at US$46.13 in the last 52 weeks.
Also Read: Top Metaverse ETFs to watch in Q2: METV, MTVR, VERS, FTEC & PUNK
Also Read: From FB, GOOGL to PINS: Top social media stocks to explore in April
Birks Group Inc. (AMEX: BGI)
Closing Price on April 21, 2022: US$5.84
The leisure industry player Birks Group Inc. designs, develops produces, and sells fine jewelry, timepieces, and gifts. Quebec, Canada based company’s operating segment includes Retail and Other. Its Retail segment consists of retail operations, and the Other segment consists of e-commerce business, wholesale business, and gold exchange business.
For the half-year or 26 weeks ended September 25, 2021, the company posted a net sale of CA$84.6 million (US$66.6 million) compared to CA$57.0 million (US$44.8 million) in the same period a year ago, reflecting an increase of 48.4% YoY. During this duration, revenue increased due to the easing of COVID-19 restrictions.
Also Read: Five student loan stocks to watch in April: DFS to SLM
Its comparable-store sales increased by 59% YoY.
Its net income came in at CA$1.0 million (US$0.786 million) for the 26 weeks compared to the net loss of CA$2.8 million (US$2.2 million) for the corresponding period in the previous year.
Its cash and equivalents grew to CA$2.68 million (US$2.11 million) as of September 25, 2021, compared to CA$1.8 million (US$1.42 million) as of March 27, 2021.
The company has a market capitalization of US$107 million. BGI stock traded in the price range of US$8.77 to US$1.38 in the last 52 weeks.
Also Read: Top mental health stocks to watch in Q2: LLY, ACHC, ITCI, LSFT & ACAD
Delta Apparel, Inc. (AMEX: DLA)
Closing Price on April 21, 2022: US$31.1
Delta Apparel Inc, with its subsidiaries, designs, markets, manufactures, and sources apparel. It has two operating segments, Delta Group and Salt Life Group. Based in Duluth, Georgia, the company offers a portfolio of activewear apparel, headwear, and accessory products.
The company sells its products through boutiques, specialty stores, departments stores, e-retailers, mid and mass channels, and the US military. It also offers products directly to customers on its website and retail stores.
Also Read: SYY to KO: 5 inflation-beating consumer staple stocks to watch in Q2
It will declare its Q2 results on May 3, 2022, and expects the net sales to be US$130 million.
For the first quarter ended December 31, 2021, its net sales were US$110.7 million compared to US$94.7 million in the previous year’s quarter. The net income came in at US$3.6 million or US$0.51 per diluted share compared to US$0.883 million or US$0.13 per diluted share in Q1, the previous year.
The company has a market capitalization of US$216 million. Its P/E ratio is 9.63, and the forward P/E for one year is 8.99.
The stock traded in the range of US$35.26 to US$24.10 in one year.
Also Read: CHDN to DKNG: Top sports stocks to watch in Q2
Express, Inc. (NYSE:EXPR)
Closing Price on April 21, 2022: US$3.35
Columbus, Ohio based fashion apparel company Express, Inc. is a specialty apparel retailer. The company offers casual wear, workwear apparel and accessories, and jeanswear. It sells products through its e-commerce website, mobile app, and franchisees.
The company booked a net loss of US$14.46 million or US$0.22 per diluted share on the net sales of US$1.87 billion in the fiscal year ended January 29, 2022. Its net loss was US$405 million or US$6.27 per diluted share on the revenue of US$1.21 billion in fiscal 2020.
The company has a market capitalization of US$224.7 million. Its P/E ratio is 19.71. EXPR stock moved in the price range of US$8.67 to US$2.74 in the last 52 weeks.
Also Read: AAL to LUV: Top 5 airlines stocks to watch after new mask rule

© Pindiyath100 | Megapixl.com
Also Read: Top dividend-paying REITs to explore: WPC, EPR, CTO, LTC & SLG
Chico's FAS, Inc. (NYSE:CHS)
Closing Price on April 21, 2022: US$5.4
Chico's FAS is an apparel retailer. This Fort Myers, Florida based company sells women's clothing and accessories. It sells directly to consumers through retail stores, websites, and call centers.
Its net sales grew to US$1.8 billion in the fiscal year ended January 29, 2022, compared to US$1.32 billion a year ago, and the net income was US$46.2 million or US$0.37 per diluted share compared to the loss of US$360 million or US$3.11 per share diluted in fiscal 2020.
The company has a market capitalization of US$645 million. Its P/E ratio is 14.23, and the forward P/E for one year is 11.74.
The stock traded in the range of US$7.29 to US$2.84 in the last 52 weeks.
Also Read: 5 agriculture stocks to explore as food inflation spikes: ADM to FMC
Bottom line:
The apparel segment witnessed high growth in 2021, backed by e-commerce and athleisure clothing demand. However, the record-high inflation could impact the industry this year. Thus, investors should carefully analyze the companies before investing in stocks.
