


Highlights
- Tesla sold over 70,000 China-made vehicles in December
- It was the most since it started manufacturing its vehicles in Shanghai in 2019
- Passenger vehicles sales totaled 2.14 million in China in December 2021
The stocks of US EV maker Tesla, Inc. (NASDAQ:TSLA) were trending on Wall Street Tuesday, after China Passenger Car Association (CPCA) data showed that Tesla sold 70,847 China-made vehicles in December. The number marked its highest monthly rate since it began manufacturing vehicles in Shanghai in 2019.
The total sales of Tesla in December were approximately three times the number it sold in December 2020. Meanwhile, the number was also up 34% from its November sales.
Considering the total delivery of December, the total sales of the EV maker were over 473,000 vehicles in 2021. Notably, the highest monthly sales were last reported in October 2021, when the automobile manufacturer sold 56,006 China-made vehicles.
Tesla has its manufacturing facility in Shanghai, from where it started delivering its vehicles at the end of 2019. It manufactures Model 3 sedans and Model Y sport-utility vehicles in the factory that are mainly sold to the domestic and international markets like Japan, Germany, etc.
Also Read: Top 5 US e-commerce stocks to explore in Q1 2022
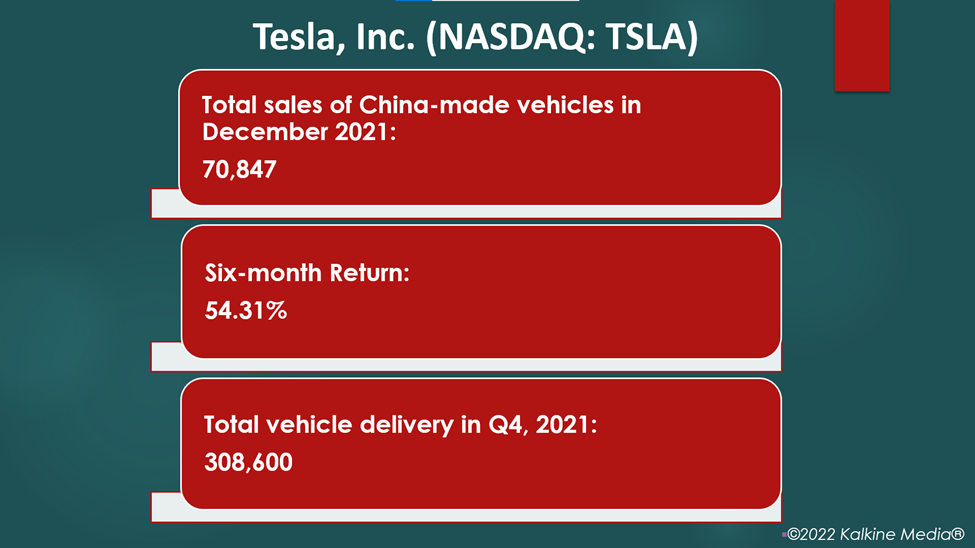
Image Description:
Also Read: NinjaFloki crypto rallies again, up 1,200%. What’s next for NJF token?
Stock performance & highlights of Tesla, Inc. (NASDAQ:TSLA):
The TSLA stocks were priced at US$1,070.06 at 5:33 am ET on January 11, up 1.13% from its previous close when it closed at US$1,058.12. Its stock value rose 54.31% over the past six months.
The firm has a market cap of US$1.06 trillion, with a P/E ratio of 342.43 and a forward one-year P/E ratio of 243.93. Its EPS is US$3.09.
Also Read: FGI Industries Ltd IPO: What does kitchen & bath firm’s FGI stock cost?
The stock saw the highest price of US$1,243.49 and the lowest price of US$539.49 in the last 52 weeks. Its trading volume was 30,604,960 on January 10.
The company's revenue surged 57% YoY to US$13.75 billion in Q3, FY21. On a GAAP basis, its net income attributable to common stockholders came in at US$1.61 billion, representing an increase of 389% YoY.
In the fourth quarter of fiscal 2021, the company manufactured a total of 305,840 vehicles and delivered 308,600 vehicles.
Also Read: Five cybersecurity stocks to watch in the first quarter of 2022
Bottom line:
Automobile sales in China rose for the first time since 2018 last year. The total sales rose 4.5% YoY to 20.5 million units, the CPCA data Tuesday showed. Meanwhile, in December 2021, the total passenger vehicle sales totaled 2.14 million in China, representing a decrease of 7.7% from December 2020.
