


Highlights
- The US ETF industry is worth US$7.0 trillion.
- A total of 445 ETFs were launched in 2021, adding US$900 billion into the ETF market.
- The Dow Jones US Technology Total Stock Market Index gained 37.44% YTD.
Exchange-traded funds (ETFs) are an inexpensive way to get diversified exposure in the stock market. Some sectors shined while some faltered amid pandemic disturbances in 2021.
However, leading retail, technology, and healthcare stocks gave an outstanding performance in 2021, helped by digital adoption.
In addition, the semiconductor and technology hardware-based ETFs grew at a faster pace than the software-heavy ETFs. Companies related to AI, cloud computing, IoT, gaming industries saw robust gains, driving up demand for hardware products.
Also Read: Are these 7 utility stocks poised for another year of growth?
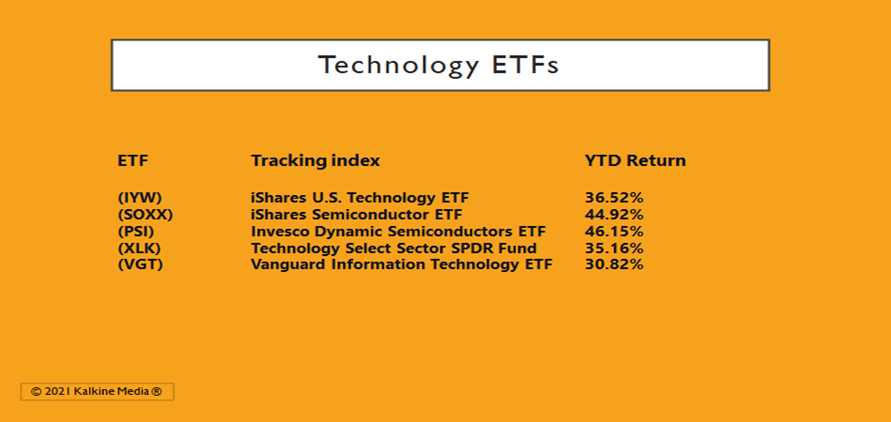
Here we discuss five technology ETFs that grew more than 25% this year.
iShares US Technology ETF (IYW)
The IYW ETF invests in US technology companies based on a market capitalization weightage approach that focuses on the large tech companies but limits the individual securities to a maximum of 22.5%. It is reviewed quarterly and reconstituted annually.
The open-ended fund was launched in 2000 by Blackrock.
Expense ratio – 0.43%
Asset Under Management (AUM) - US$10.12 billion
Average Daily Dollar Volume - US$54.60 million
Average Daily Share Volume - 485,468
Total holdings – 149
The ETF gave a 36.52% return YTD and closed at US$116.15 on Dec 28, 2021. Its ex-dividend date is March 24, 2022, and the dividend yield is 0.57%.
The P/E ratio is 35.62 and its P/B ratio is 10.75.
Also Read: Top 8 US vaccine stocks of 2021
Also Read: These 5 US stocks returned between 500% and 5,000% in 2021
iShares Semiconductor ETF (SOXX)
It is a passively managed fund and provides exposure to 30 semiconductor companies in the US. It uses the market cap weightage method for selecting the companies.
Those with a minimum market cap of US$100 million are included in the index. These companies manufacture semiconductor materials, equipment or provide related services.
Launched in 2001 by Blackrock, it is an open-ended fund. It tracks ICE Semiconductor Index – Benchmark TR Gross.
Expense ratio – 0.43%
Asset Under Management (AUM) - US$9.87 billion
Average Daily Dollar Volume - US$410.32 million
Average Daily Share Volume - 797,156
Total holdings – 30
The ETF gave a 44.92% return YTD and closed at US$549.5 on Dec 28, 2021. Its ex-dividend date is March 24, 2022, and the dividend yield is 1.09%.
The P/E ratio is 28.39, and its P/B ratio is 6.72.
Also Read: 5 best US oil & gas stocks that returned over 100% in 2021
Invesco Dynamic Semiconductors ETF (PSI)
The PSI ETF is a passively managed fund and gives exposure to 30 companies in the US semiconductor industry using its proprietary methodology.
The selection of companies is based on factors like earnings, quality, price momentum, value, and management. It also includes smaller companies. The open-ended fund was launched by Invesco in 2005 and tracks the Dynamic Semiconductor Intellidex Index.
Expense ratio – 0.56%
Asset Under Management (AUM) - US$908.67 million
Average Daily Dollar Volume - US$7.05 million
Average Daily Share Volume - 48,137
Total holdings – 30
The ETF gave a 46.15% return YTD and closed at US$153.35 on Dec 28, 2021. Its P/E ratio is 37.60, and its P/B ratio is 6.78.
Also Read: 2 US energy stocks with over 7% dividend yield
Technology Select Sector SPDR Fund (XLK)
The ETF includes companies from different technology segments such as IT services, semiconductors, telecommunication, etc. The small-cap and mid-cap companies are not included in the portfolio, giving the ETF lower volatility.
It is one of the cheapest and the largest funds in the category. It was launched by State Street in December 1998. It is an open-ended fund and tracks the S&P Technology Select Sector Index.
Expense ratio – 0.12%
Asset Under Management (AUM) - US$51.62 billion
Average Daily Dollar Volume - US$1.91 billion
Average Daily Share Volume - 11,382,144
Total holdings – 75
The ETF gave a 35.16% return YTD and closed at US$175.73 on Dec 28, 2021. Its P/E ratio is 32.93, and its P/B ratio is 11.52.
Also Read: Top 3 US 5G stocks to watch in 2022

Source – Pixabay
Also Read: Top 5 retail stocks to keep an eye on in 2022
Vanguard Information Technology ETF (VGT)
It is also a diversified technology ETF that follows the market-cap-weighted method. It includes small and micro-cap companies.
The credit card companies are a part of this ETF but not the telecom firms. Launched in 2004 by Vanguard, it is an open-ended fund. It tracks the MSCI US Investable Market Information Technology 25/50 Index.
Expense ratio – 0.10%
Asset Under Management (AUM) - US$56.27 billion
Average Daily Dollar Volume - US$218.99 million
Average Daily Share Volume - 491,720
Total holdings – 364
The ETF gave a 30.82% return YTD and closed at US$462.84 on Dec 28, 2021. Its dividend yield is 0.68%. Its P/E ratio is 37.53, and its P/B ratio is 11.09.
Also Read: Top 2 cloud computing stocks to watch in 2022
Bottomline
September saw the highest number of ETF debutants, totaling 70. In addition, a total of 445 new ETFs were launched this year, of which 75 were based on a fixed income. Also, there were 298 actively managed ETFs and around 147 passively managed ETFs. ETFs are considered safer for investment, but investors should analyze them carefully before investing.
