.jpg)


Source:ShutterstockProfessional, Shutterstock
Nasdaq 100 has contoured another record high, delivering good returns to investors after a dreadful half year witnessed during the first half of the year 2020.
The surge in the benchmark index has been well supported by giants such as Apple Inc (NYSE:AAPL), Amazon.com Inc (NYSE:AMZN), and Alphabet Inc or Google (NYSE:GOOG) climbing near to their previous record values.
Apple Inc (NYSE:AAPL)
In August 2020, Apple achieved a milestone with the iPhone maker becoming the first publicly trading $2 trillion Company across the United States.
Apple surpassed a $1 trillion dollar market cap in August 2018, surpassing the Saudi oil behemoth – Aramco to become the most valuable company globally. And now, the market value of more than $2 trillion is higher than the GDP of many developed countries, such as Canada, Russia, and South Korea, to name a few.
Post reaching a share price of ~ $470 in August 2020, Apple finalised a four-for-one stock split, making the share more affordable for investors.
For years AAPL has hoarded cash but is now switching its strategies to reduce the net cash position with the Company distributing $30 billion to shareholders during the first quarter of the financial year 2021, in line with its target of reaching a net cash neutral position over time.
How are the charts looking for Apple?

AAPL Daily Price Chart (Image Source: EODHD/Others Eikon Thomson Reuters)
On following the daily chart, it could be see that the stock is currently in an uptrend with prices moving well above the 200-day and 50-days exponential moving averages.
- Apple recently attempted a volatility breakout with prices crossing the +2 Standard Deviation of the 20-day simple Bollinger Band®. However, the stock remained unable to sustain the same and is currently retracing back to test the bottom uptrend line of the support zone.
- The bottom uptrend line of the support zone is also overlapping with the 50-day EMA; thus, could be predictive in nature. A break and price action below the same with some conformity could see bearish sentiments.
- The major support for the stock is at $125.22 (horizontal line), which is overlapping with the -2 Standard Deviation of the 20-day simple Bollinger Band®.
- While OBV has been moving in tandem with the price action, suggesting that the recent surge is well-supported by large volumes, the ADX is showing a divergence, which could be an early signal of weaking trend.
- The major hurdle for the stock is at the upward trendline of the support zone, which is near the +2 Standard Deviation. A break and price action above the same could further fuel bullish sentiments ahead.
Amazon.com Inc (NYSE:AMZN)
On its fifth try to join the $1 trillion club, Amazon has remained successful in maintaining its valuations to become the fourth tech company to join league with Apple, Microsoft, and Google parent Alphabet Inc. Amazon has often reached that mark but was unsuccessful in maintaining the market cap.
Amazon has been in the news lately, after its founder, Jeff Bezos announced his retirement. Let us gauge the mood of the investors on the charts.

AMZN Daily Price Chart (Image Source: EODHD/Others Eikon Thomson Reuters)
On following the daily chart, it could be seen that Amazon has recently given a breakout above a symmetrical triangle formation, reflecting the end of a consolidation phase seen over past many trading sessions.
- Apart from that, the stock has also given a volatility breakout with prices crossing the +2 Standard Deviation of the 20-day simple Bollinger Band®. However, the bulls were unable to sustain the same and the stock is currently retracing back to test the support line, i.e., the upper downward sloping line of the triangle like formation, which is also overlapping with the 50-day EMA; thus, could be predictive in nature.
- A break and price action below the same could seed bearish sentiments.
Alphabet Inc, Google (NYSE:GOOG)
Alphabet Inc – the parent Company of Google reached a trillion dollar mark in January last year, becoming the third U.S. company to reach the milestone post Apple and Microsoft.
The major optimism around Google came into limelight over its growth in the Cloud business, despite lagging considerably behind Microsoft Azure and AWS (Amazon Web Services).
Apart from that, many other business segments, including search, advertising, YouTube, and Android, have been major pillars towards Alphabet’s journey to a trillion dollar mark.
Many industry experts anticipate the clouding business of the Company to witness similar growth as Azure over extensive resource pouring.
So far, Google or Alphabet Inc has been able to preserve its status of a trillion-dollar company despite slight indication of slowing profit in recent quarters and number of clashes including an investigation by the U.S. National Labor Relations Board and various state and federal antitrust probes.
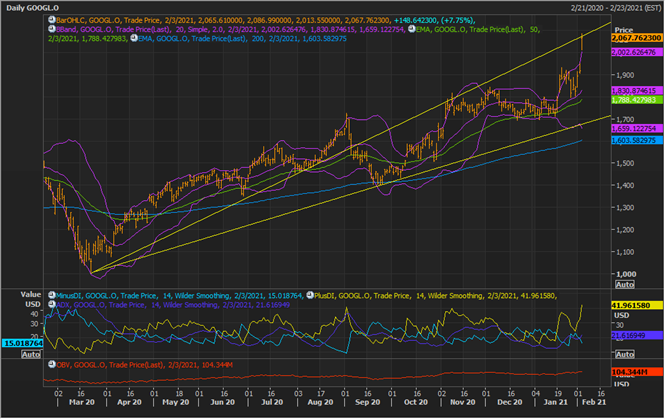
GOOG Daily Price Chart (Image Source: EODHD/Others Eikon Thomson Reuters)
On following the daily chart, it could be seen that GOOG is testing the resistance of the extended medium-term trendline after giving a volatility breakout.
The stock breached the +2 Standard Deviation of the 20-day simple Bollinger Band® while receiving decent volume backing, which in turn, has now increased the volatility in the stock.
Also, at present, the stock is trading well within the support zone (between two trendlines); however, the relative daily move is increasing, leading to a surge in volatility as well.
The surge in the daily price range is putting a large gap between the resistance and the support line, suggesting that the risk is slightly increasing in the stock.
The major support for the stock is at the upward sloping trendline, which is also overlapping with the +2 Standard Deviation is close to the 200d-day EMA; thus, could be decisive in nature. A break and price action below the same could seed bearish sentiments ahead.
