


Highlights:
- Definition: The Arms Index, or Trading Index (TRIN), measures market breadth by comparing advancing and declining issues and volumes.
- Bullish and bearish signals: Values below 1.0 indicate bullish conditions, while values above 1.0 suggest bearish sentiment.
- Smoothing technique: The index is often smoothed using a simple moving average to provide clearer trends and signals.
The Arms Index, commonly known as the Trading Index (TRIN), is a valuable tool for traders and analysts seeking to gauge market sentiment and breadth. By examining the relationship between advancing and declining stocks, as well as their respective trading volumes, the Arms Index provides insights into the strength or weakness of market movements. This index serves as an essential indicator in the toolkit of those involved in technical analysis, helping them to make informed decisions based on market dynamics.
How the Arms Index is Calculated
The Arms Index is calculated using a straightforward formula that incorporates two key elements: the number of advancing issues and the number of declining issues, along with the advancing volume and the declining volume. The calculation proceeds in the following manner:
1. Advancing Issues and Declining Issues: The first step involves counting the number of stocks that are advancing (increasing in price) and the number of stocks that are declining (decreasing in price).
2. Volume Assessment: Next, the advancing volume (the total number of shares traded for advancing stocks) is compared to the declining volume (the total number of shares traded for declining stocks).
3. Calculation Formula: The Arms Index is then calculated by dividing the ratio of advancing issues to declining issues by the ratio of advancing volume to declining volume. The formula can be expressed as:
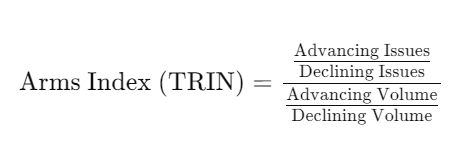
This formula allows the Arms Index to reflect both price movements and the volume of trades, providing a more nuanced view of market conditions.
Interpreting the Arms Index
The interpretation of the Arms Index is relatively straightforward. Values of the index convey important signals regarding market sentiment:
- Bullish Sentiment (Below 1.0): When the Arms Index falls below 1.0, it typically indicates bullish conditions in the market. This scenario suggests that a greater volume of shares is advancing compared to those that are declining, which may reflect positive investor sentiment and potential upward momentum.
- Bearish Sentiment (Above 1.0): Conversely, when the Arms Index exceeds 1.0, it indicates bearish sentiment. In this case, the declining issues and volume outpace the advancing ones, suggesting that the market may be experiencing downward pressure and negative sentiment among investors.
Smoothing the Arms Index
To enhance the clarity of signals generated by the Arms Index, many traders apply a simple moving average (SMA) to the index. This smoothing technique helps filter out noise and short-term fluctuations, allowing for a better understanding of longer-term trends in market breadth.
By averaging the Arms Index values over a specified period—such as 5, 10, or 20 days—traders can identify shifts in market sentiment more effectively. For example, a rising moving average may indicate increasing bullish sentiment, while a declining moving average could signal strengthening bearish sentiment.
Practical Applications of the Arms Index
The Arms Index can be a valuable tool for various trading strategies and market analyses. Here are some practical applications:
1. Market Timing: Traders can use the Arms Index to identify potential entry and exit points in the market. A low Arms Index value may signal a good time to enter long positions, while a high value could suggest taking profits or entering short positions.
2. Divergence Analysis: Analyzing divergences between price movements and the Arms Index can provide insights into market trends. For instance, if prices are reaching new highs while the Arms Index is rising, it may suggest underlying weakness, indicating a potential reversal.
3. Combining with Other Indicators: The Arms Index can be used in conjunction with other technical indicators to strengthen trading decisions. For instance, when combined with moving averages, relative strength index (RSI), or momentum indicators, traders can gain a more comprehensive view of market conditions.
4. Volatility Assessment: Changes in the Arms Index can help traders gauge market volatility. Rapid fluctuations in the index may indicate heightened uncertainty or shifts in market dynamics, prompting traders to adjust their strategies accordingly.
Limitations of the Arms Index
While the Arms Index is a useful tool, it is not without limitations. Some of the challenges include:
- Market Conditions: The Arms Index can be influenced by broader market conditions, such as economic events, geopolitical developments, or significant news announcements. Traders should consider these factors when interpreting the index.
- False Signals: Like many technical indicators, the Arms Index may produce false signals or whipsaws, particularly in volatile markets. Traders must exercise caution and consider using additional confirmation signals before acting on the index.
- Overreliance: Solely relying on the Arms Index without considering other market factors can lead to poor decision-making. A well-rounded trading strategy should incorporate multiple indicators and analyses.
Conclusion
The Arms Index (TRIN) is an essential indicator for assessing market breadth and sentiment, offering traders valuable insights into the dynamics of advancing and declining stocks. By calculating the ratio of advancing to declining issues and volumes, the Arms Index provides clear signals that can guide trading strategies and market decisions. Whether used to time market entries, identify divergences, or assess volatility, the Arms Index remains a crucial component of technical analysis. However, traders should be mindful of its limitations and use it in conjunction with other tools for comprehensive market evaluation.
