


Highlights:
- GME stock returned gains of about 20 per cent YTD.
- AMC stock had an RSI of over 71.
- HKD stock grew by over 1041 per cent in one month.
The meme stocks rose to popularity during the COVID-19 pandemic. Popular meme stocks are GameStop Corporation (NYSE:GME), AMC Entertainment Holdings, Inc. (NYSE:AMC), Bed Bath & Beyond Inc. (NASDAQ:BBBY), AMTD Digital Inc. (NYSE:HKD), and Palantir Technologies Inc. (NYSE:PLTR).
Now, some might be thinking that what are meme stocks? The stocks of the companies skyrocket after individual small and retail investors create hype over it on social media platforms like Reddit, etc.
However, some traditional investors and analysts consider the meme stocks riskier than general stocks, as their price typically swings based on the interests of the retail investors.
The meme-stocks price generally rockets in a short period, mostly hours or days, due to a sudden interest from investors on online social media platforms. However, the price could reverse its track also following a sudden rally, which makes the meme stocks more volatile than the overall equity market.
The trend has gained popularity mainly in the last two years. The trend had an unofficial start in the 2020 summer when people were forced to stay at home due to the pandemic restrictions, thus providing them some time to gain some extra money from the equity market. In addition, several active users on social media also turned their focus to the equity market, bolstering the popularity of the "meme-stock" trend.
Some popular memes stocks appear to have attracted stock market enthusiasts in recent days. Let's explore the recent price performance and financial highlights of the following meme stocks with Kalkine Media®.
GameStop Corporation (NYSE:GME)
One of the most popular meme-stock, GameStop Corporation, holds a market cap of US$ 13.26 billion. The video game and consumer electronics retail firm has gained attention from investors after it announced the launch of its non-fungible token (NFT) marketplace on July 11, which would allow the gamers, creators, and community members to purchase, sell, or trade NFTs.
In addition, its four-for-one stock split news also attracted several investors. Meanwhile, the GME stock surged more than 12 per cent on August 16.
The US$ 13.64 billion market cap stock returned gains of nearly 20 per cent this year while soaring about eight per cent year-over-year (YoY). On August 16, the GME stock traded around 129 per cent above its 52-week low of US$ 19.395, recorded on March 14, 2022.
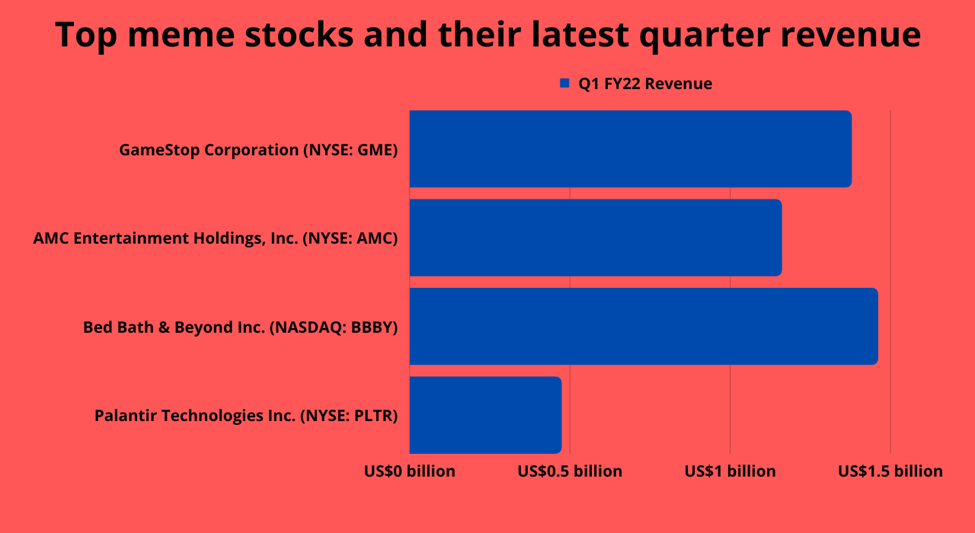
In the first quarter of fiscal 2022, GameStop posted net sales of US$ 1.378 billion, against US$ 1.277 billion in the year-ago quarter. Its net loss deteriorated to US$ 157.9 million, or US$ 2.08 per diluted share in Q1 FY22, from a loss of US$ 66.8 million in Q1 FY21.
AMC Entertainment Holdings, Inc. (NYSE:AMC)
The stock of the movie theatre chain operator declined about 30 per cent in the past 12 months while decreasing about eight per cent year-to-date (YTD). However, in the ongoing quarter, it showed over 82 per cent gains till August 16.
It had a relative strength index or RSI of over 71, according to EODHD/Others data. Some analysts believe that RSI over 70 represents the stock in an overbought condition.
At the time of drafting, it traded over 155 per cent from its 52-week low of US$ 9.70, recorded on May 12, 2022.
The Leawood, Kansas-based firm posted revenue of US$ 1.16 billion in Q2 FY22, against US$ 444.7 million in the same quarter of the prior year. AMC Entertainment reported a net loss of US$ 121.6 million in Q2 2022 compared to US$ 344 million in Q2 2021.
Bed Bath & Beyond Inc. (NASDAQ:BBBY)
The retail store operator seemed to have gained attention from the investors in recent days, as evidenced by the climb in its price. The BBBY stock rose nearly 80 per cent this year while climbing over 428 per cent in the ongoing quarter. However, on a YoY basis, it fell over four per cent.
The BBBY stock had a Relative Strength Index (RSI) of around 90, according to EODHD/Others data.
The net sales of Bed Bath & Beyond fell 25 per cent YoY to US$ 1.46 billion in Q1 FY22. Its net loss was US$ 358 million against a loss of US$ 51 million in Q1 FY21.
 Source: ©Kalkine Media®; © Canva via Canva.com
AMTD Digital Inc. (NYSE:HKD)
AMTD Digital is the latest meme stock that had to take Wall Street by storm with its abnormal surge since it got listed in mid-July. In one month, it soared more than 1041 per cent. It touched a 52-week high of US$ 2,555.3 on August 2, 2022, while its 52-week low of US$ 12.05 was noted on July 15, 2022.
The Hong Kong-based financial technology company holds a market cap of about US$ 34.97 billion.
For the fiscal year that ended on December 31, 2021, the company's total revenue jumped about 25 per cent YoY to HK$ 1.39 billion. Its profit for the year was HK$ 1.22 billion, compared to a profit of HK$ 1.13 billion in the same period of the prior year.
Palantir Technologies Inc. (NYSE:PLTR)
The software company holds a market cap of US$ 19.88 billion. The PLTR stock fell over 47 per cent YTD while decreasing nearly 61 per cent in the last 12 months. However, it showed over five per cent gains in the ongoing quarter.
The stock of the technology firm had an RSI of around 46, EODHD/Others data showed. According to some analysts, RSI between 30 and 50 suggests that the stock could be highly volatile at the moment.
Palantir Technologies posted a 26 per cent growth in its second quarter fiscal 2022 revenue of US$ 473 million. Its net loss was US$ 179.32 million versus a loss of US$ 138.58 million in Q2 FY21.
Bottom line:
The year 2022 hasn't been a smooth journey so far for the wider market. Inflation is at its peak, and Federal Reserve is trying to bring it down to its two per cent target, raising concerns over slowing economic growth. Some investors also anticipate that a further aggressive stance by the Federal Reserve could tip the economy into a recession.
The S&P 500 index fell 3.82 per cent in the last 12 months while declining over nine per cent this year. On the other hand, the Dow Jones Industrial Average (DJIA) plummeted 4.51 per cent YoY while falling 6.68 per cent YTD.
