

The FTSE MIB index has crawled back this week, rising in the past seven days and reaching its highest level since November 6. The index, which tracks the biggest companies in Italy, rose to €34,625, up by 6% from its lowest level in November.
Why Italian stocks are soaring
The FTSE MIB index has joined other European indices like the DAX 40 and IBEX 35 in staging strong rally.
Most of these gains accelerated after economic data from the region showed that the economy was not doing well.
The manufacturing and services PMI numbers remained below 50, signaling that the sectors were contracting.
More data released recently showed that the economy expanded by 0.4% in the third quarter after contracting in the previous quarters.
Broadly, many European companies are struggling because of their exposure to China, a struggling economy. Manufacturers are also contending with higher energy costs than in other countries.
European stocks have also done well because of the relatively weaker euro. The EUR/USD exchange rate has dropped from the September high of 1.1200 to the current 1.0575.
Top performers in the FTSE MIB index
Most companies in the FTSE MIB index have done well this year. Banks have led the charge as higher interest rates have made them more profitable this year.
Bper Banca, which has over 4.3 million customers, was the best-performing companies as the stock jumped by 100%. This growth was mostly because of its strong financial results.
The most recent earnings showed that Bper’s net profit jumped to over €412 million in the third quarter, a 6.3% QoQ increase. It also reported an improvement in its CET1 ratio, which rose to 15.8%. This ratio means that the company has adequate resources that could see it increase its dividends.
Banco Bpm, another bank with over 4 million customers, has also done well as its stock jumped by 57% this year. This rally happened as the company reported strong financial results, helped by higher interest rates.
Banca Monte dei Paschi, the world’s oldest bank, rose by over 108% this year. The other notable gainers were companies like Ferrari NV, Poste Italiene, Iveco, Unicredit, and Prysmian.
Unicredit has become one of the best-performing banks in the past few years, helped by its strong earnings and dividends. In one of its most ambitious targets, the company has accumulated more Commerzbank shares, a move that may let it acquire the bank.
Not all companies in the FTSE MIB index have done well this year. Stellantis, the giant automaker that owns Fiat, Jeep, and Chrysler, has collapsed by 40% this year. The company, which forced its CEO out, is going through a major slowdown as demand wanes. Its retreat has coincided with that of other companies like Volkswagen and Renault.
Telecom Italia stock has dropped by almost 20% this year, while Eni, Campari, Amplifon, ERG, STMicroelectronics, and Nexi have plunged by over 20% this year.
FTSE MIB index analysis
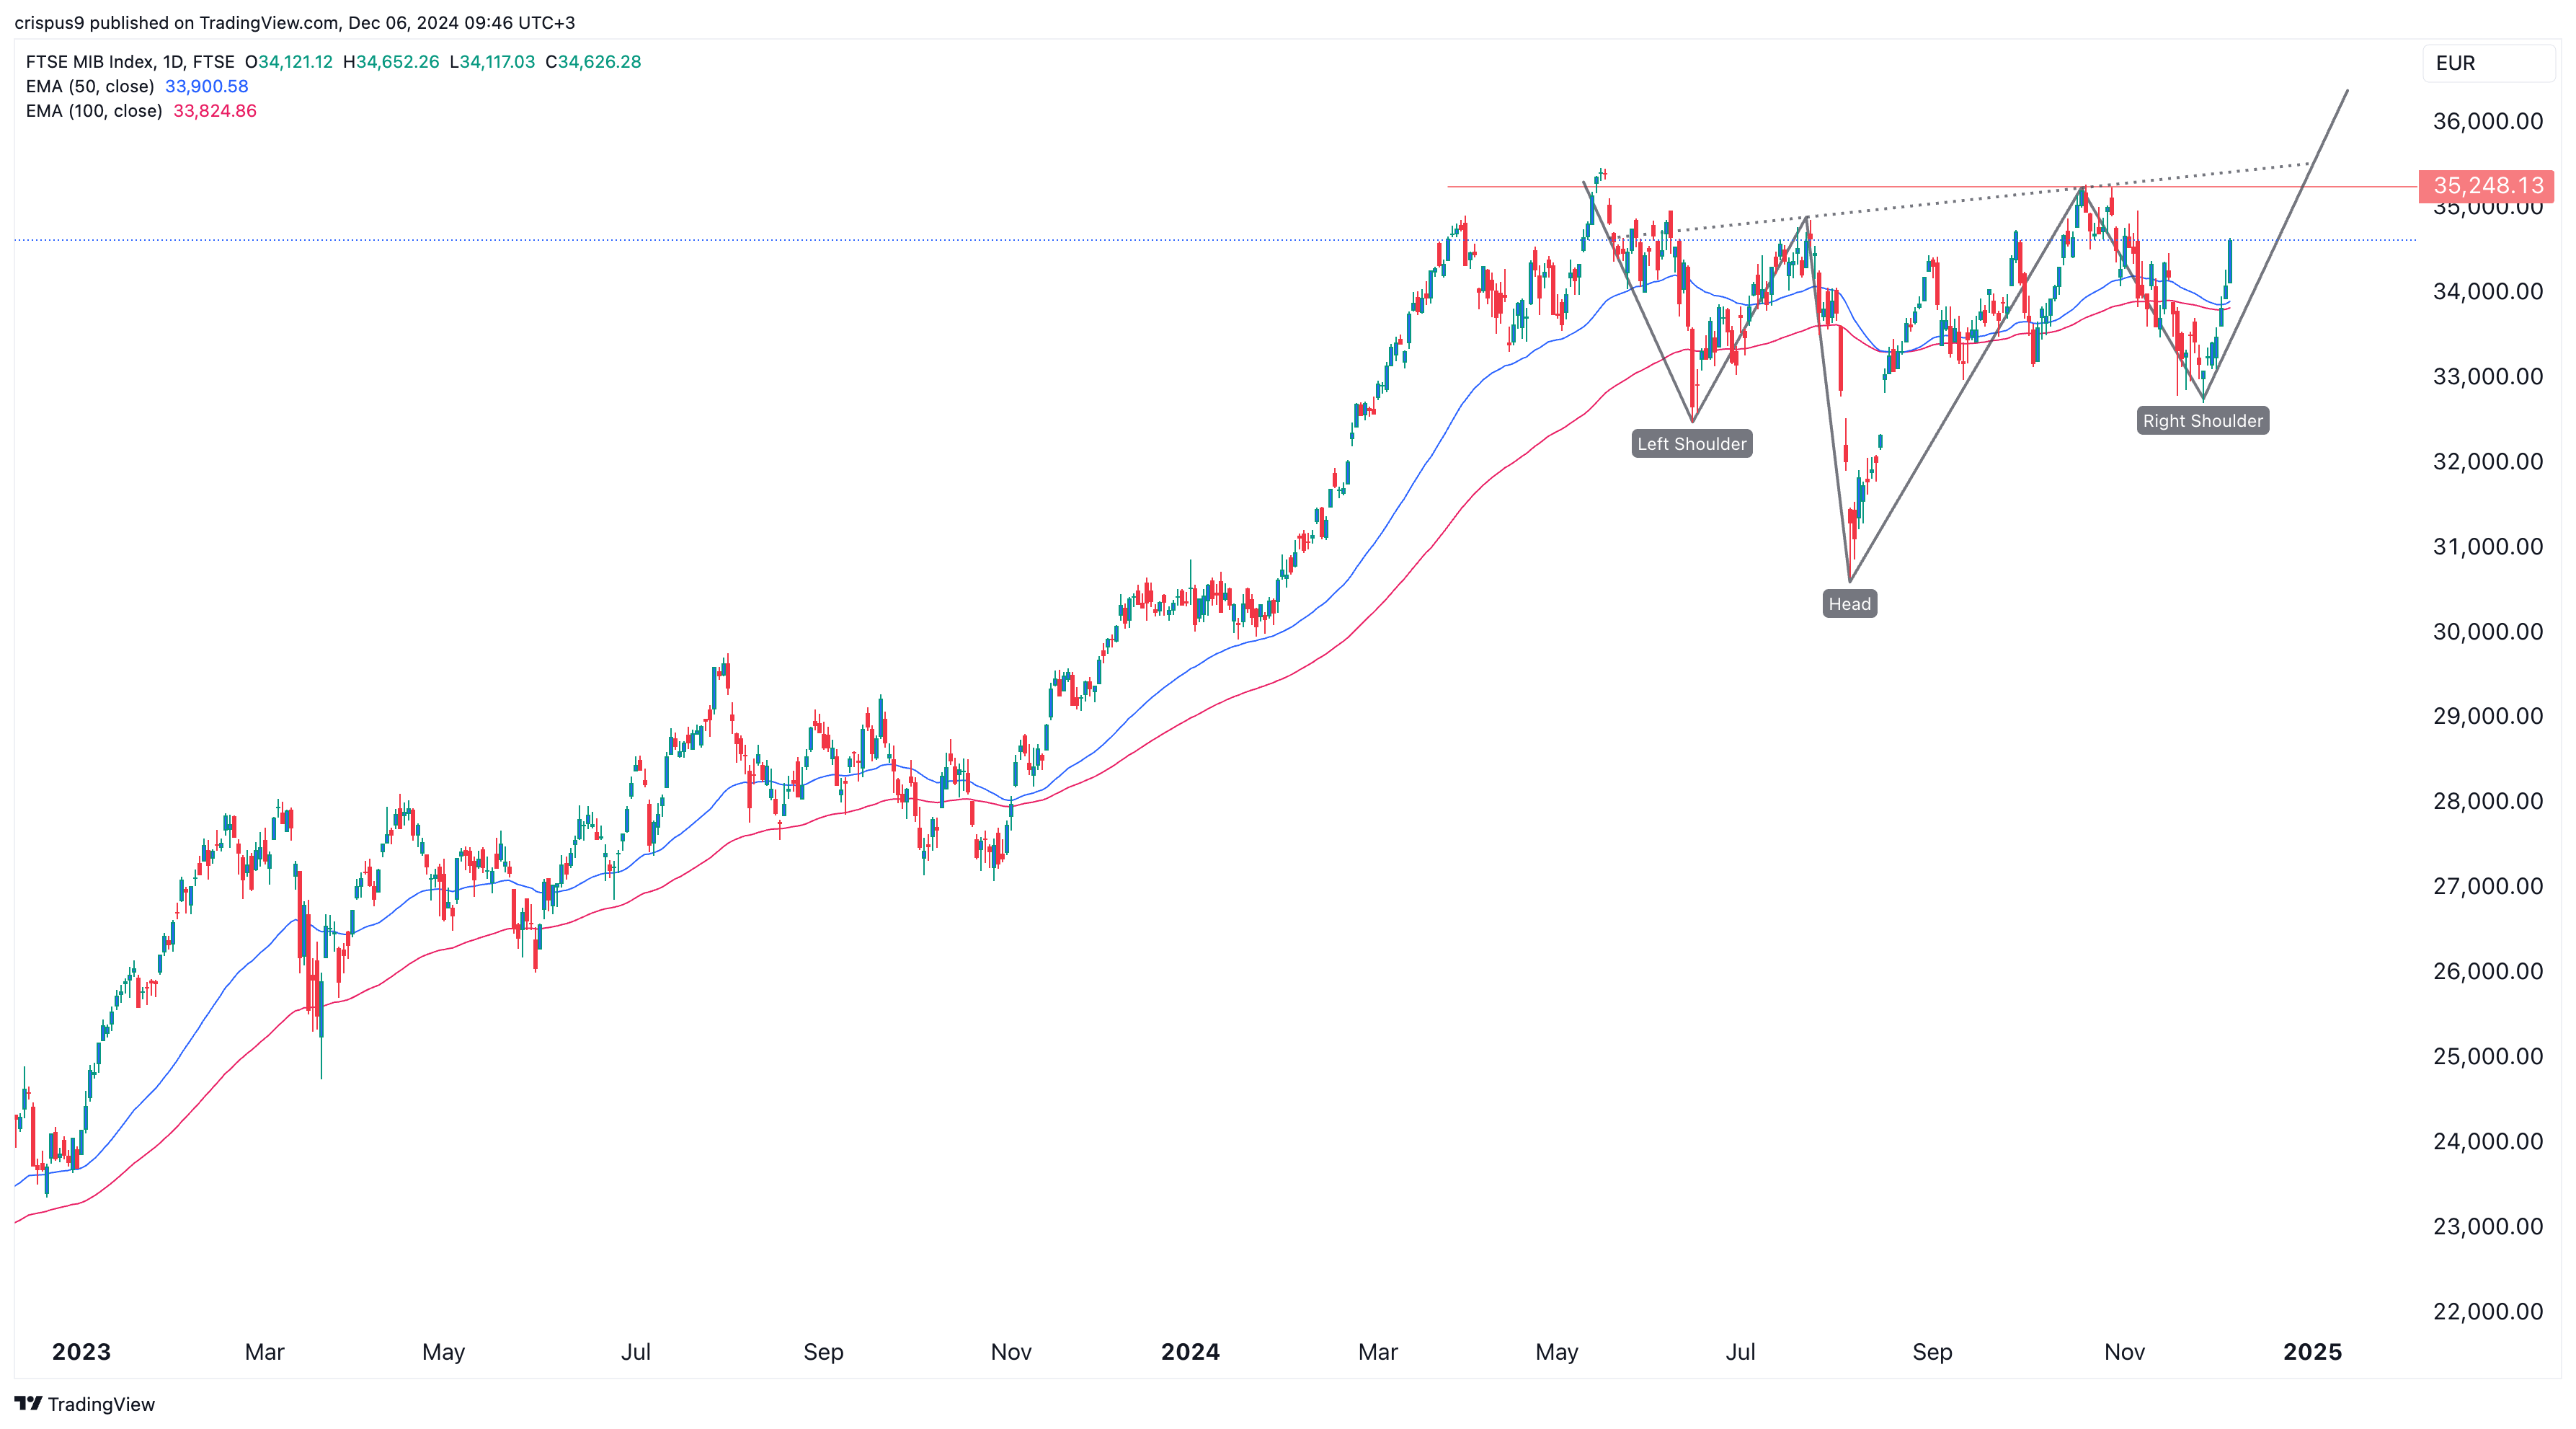
The daily chart shows that the FTSE MIB index has rallied in the past few days. It has rallied above the 50-day and 100-day Exponential Moving Averages (EMA).
Most importantly, the index has formed an inverse head and shoulders pattern, a popular bullish sign. In most periods, this is one of the most bullish patterns in the market.
The FTSE MIB index stock’s Relative Strength Index (RSI) and the MACD indicators have all pointed upwards.
Therefore, because of the inverse H&S pattern, the index will likely continue rising as bulls target the key resistance at €36,000. More gains will be confirmed if the stock rises above the neckline at €35,250.
The post FTSE MIB index forms an extremely bullish chart pattern appeared first on Invezz
