


Source: Copyright © 2021 Kalkine Media Pty Ltd.
Summary
- The S&P 500 and the Dow Jones Industrial Average closed at a record high on Monday
- The economy added 916,000 jobs in March, the highest growth since August 2020.
- U.S. is reportedly working with G20 nations on a global minimum corporate tax rate.
The U.S. stock market benchmarks the S&P 500 and the Dow Jones Industrial Average closed at a record high on Monday, April 5, 2020, following the strong jobs report for March, which showed signs of recovery in economic activities.
The S&P 500 grew 1.44 percent to 4,077.91. The Dow Jones was up 1.13 percent to 33,527.19. The NASDAQ Composite Index surged 1.67 percent to 13,705.59 while the small-cap Russell 2000 inched up 0.49 percent to 2,264.89.
The U.S. Bureau of Labor Statistics said the economy added 916,000 non-farm jobs during March, the highest job growth since August 2020. The unemployment rate in March declined to 6 percent from 6.2 percent in February. The number of unemployed persons totaled 9.7 million during the month.
Meanwhile, Treasury Secretary Janet Yellen reportedly said she is working with G20 nations for a global minimum corporate tax rate. Yellen’s call for the minimum cooperate tax comes when President Joe Biden has proposed to increase corporate tax rate to fund the massive US$2 trillion infrastructure package.
The U.S. Census Bureau on Monday reported a 0.8 percent decline in new orders for manufactured goods during February to US$505.7 billion. In January, new orders were up 2.7 percent.

©Kalkine Group 2021.
Top Gainers
Top performers on S&P 500 were Norwegian Cruise Line Holdings Ltd. (7.18%), General Motors Co. (5.61%), MGM Resorts International (5.04%) and Freeport-McMoRan Inc. (4.74%).
Chembio Diagnostics Inc. (60.23%), Xcel Brands Inc. (51.27%), Sequential Brands Group Inc. (32.40%), Vivos Therapeutics Inc. (27.21%) were top performers on NASDAQ.
On Dow Jones, Walgreens Boots Alliance Inc. (3.74%), Intel Corp. (3.08%), Walmart Inc. (2.81%) and Microsoft Corp. (2.77%) gained the most.
Top Losers
Top laggards on S&P 500 were Enphase Energy Inc. (8.16%), Occidental Petroleum Corp. (7.56%), Pioneer Natural Resources Co. (7.55%) and Diamondback Energy Inc. (7.17%).
Elite Education Group International Ltd. (26.11%), Uxin Ltd. (23.86%), Molecular Templates Inc. (23.55%) and Castor Maritime Inc. (20.98%) were among the top losers on NASDAQ.
On Dow Jones, Goldman Sachs Group Inc. (1.25%), Chevron Corp. (1.17%), Walt Disney Co. (0.25%) and Merck & Co Inc. (0.12%) were laggards.
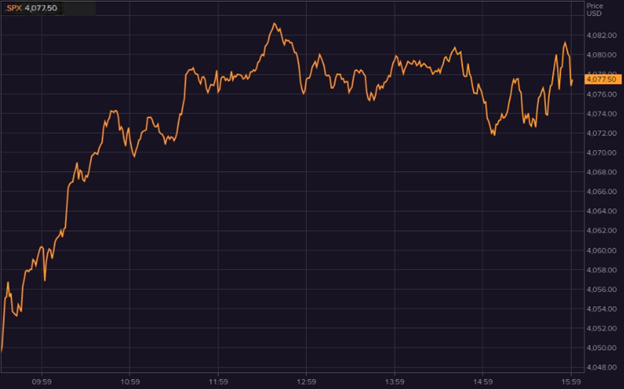
Image Source: EODHD/Others, S&P 500 April 5, 2021 price chart
Volume Movers
Top volume movers are Castor Maritime Inc. (46.23M), Chembio Diagnostics Inc. (29.74M), Apple Inc. (17.54M), ViacomCBS Inc. (15.82M)
Futures & Commodities
Gold futures were up 0.04 percent to US$1,729.05 per ounce. Silver fell 0.16 percent to US$ 24.907 per ounce while copper grew 3.71percent to US$4.1387.
Brent oil futures inched up 0.03 percent to US$62.26 per barrel and WTI crude declined 4.36 percent to US$ 58.77 per barrel.
Bond Market
The 30-year Treasury bond yields fell 0.90 percent to 2.349 while the 10-year bond yields were down 0.73 percent to 1.707.
US Dollar Futures Index was down 0.48 percent to US$92.600.
