


Summary
- Persimmon Plc had reported its FY20 revenue to drop by 8.8% to around £3.33 billion.
- The forward sales of the Company had increased by 25% year-on-year to £1.689 billion for FY20.
- The average weekly sales rate per site grew by 39% during H2 FY20.
- The Company had delivered 8,675 new home completions during H2 FY20.
Persimmon Plc (LON:PSN) is the FTSE 100 listed real estate stock. The Company is the leading housebuilding company within the United Kingdom. Based on its 1-year performance, shares of PSN have generated a return of about negative 6.58%.
The Company will release FY20 results ending 31 December 2020 on 03 March 2021.
Business Model
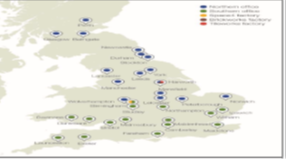
The Company build houses across the UK. The Company operates through various geographic segments –
- Yorkshire
- Scotland
- North West
- North East
- Midlands
- Eastern
The Company is focused on trading under the following three brands –
- Persimmon Core – It comprises homes ranging from studio apartments to family homes covering around 380 locations.
- Charles Church – The Company build homes under this brand across various geographic regions.
- Westbury Partnerships – The Company sells affordable social housing under this brand.
(Source: Company presentation)
Five Year Financial Summary
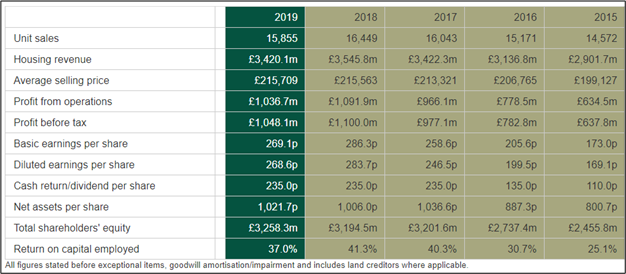
(Source: Company website)
Pre Closing FY20 Trading Update (as on 13 January 2021)
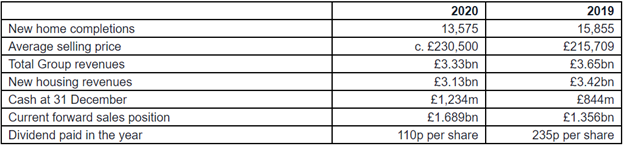
(Source: Company update)
- The Company had demonstrated a resilient trading performance despite the operational headwinds presented by the Covid-19 pandemic.
- The total revenue of the Company was dropped by 8.8% to around £3.33 billion during FY20, while it was £3.65 billion during FY19. The new housing revenue also dropped to £3.13 billion during FY20 from £3.42 billion during FY19.
- The Company had delivered 8,675 new home completions during H2 FY20.
- The total new home legal completions during FY20 were 13,575.
- The average selling price grew by 7% from £215,709 during FY19 to £230,500 during FY20.
- The average weekly sales rate per site also grew by 39% during H2 FY20 compared to H2 FY19 well supported by stamp duty measures taken by the Government.
- The Company had witnessed a decline in average outlets from 345 in FY19 to 305 as of 31 December 2020.
- The forward sales of the Company had increased by 25% year-on-year to £1.689 billion for FY20 compared to £1.356 billion during FY19.
- The Company had maintained a cash balance of £1,234 million as of 31 December 2020.
- The Company had an available liquidity of £300 million.
Recent News
On 17 December 2020, the Company announced that Andrew Wyllie had joined as an independent non-executive director effective from 04 January 2021.
Financial Highlights (for first six months ended 30 June 2020) as reported on 18 August 2020
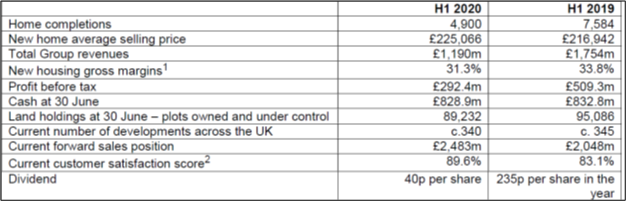
(Source: Company result)
- The total revenue of the Company had declined by 32% to £1.19 billion during H1 FY20 ended on 30 June 2020 from £1.75 billion achieved during an equivalent period of the prior year.
- The new housing gross margins went down by 150 basis points to 31.3% during H1 FY20.
- The Company had reported a 42.6% decline in its profit before tax from £509.3 million during H1 FY19 to £292.4 million during H1 FY20.
- Regarding its financial position, the Company had managed to maintain its cash balance of £828.9 million as of 30 June 2020, while it was £832.8 million as of 30 June 2019.
- The Company had a return on equity of 21.5% for H1 FY20, while it was 31.0% during H1 FY19.
- The Company had declared an interim dividend of 40 pence per share during H1 FY20 despite a challenging business environment due to the emergence of Covid-19 pandemic during the period. The dividend was 235 pence per share for FY19.
- The home completions had dropped from 7,584 during H1 FY19 to 4,900 for H1 FY20. The new home average selling price had increased to £225,066 during H1 FY20, while it was £216,942 during H1 FY19
Operational Highlights (as on 18 August 2020)
- The first-time buyers had 50% of private legal completions for H1 FY20.
- The Company had invested over £675 million in last 18 months towards local communities.
- The Company had land replacement of 55% of consumption level after having all acquisitions meeting certain criteria.
- The current customer care score also improved from 83.1% to 89.6% during H1 FY20.
Share Price Performance Analysis of Persimmon Plc
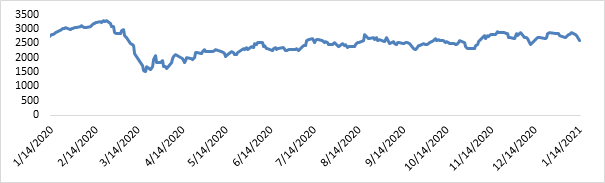
(Source: EODHD/Others, chart created by Kalkine group)
Shares of Persimmon Plc were trading at GBX 2,637.00 and were up by close to 0.96% against the previous closing price as on 14 January 2021, (before the market close at 09:00 AM GMT). PSN's 52-week High and Low were GBX 3,328.00 and GBX 1,367.50, respectively. Persimmon Plc had a market capitalization of around £8.33 billion.
Business Outlook
The Company had entered FY21 with a positive momentum reflected by total forward sales of £1.689 billion as of 31 December 2020. The Company had ten sites under construction which would have sales open shortly, and it had plans to open 50 more sites by the end of H1 FY21 further strengthening the diverse network. The several factors like tightening of Covid-19 restrictions, the commencement of rollout of Covid-19 vaccine and the end to a stamp duty holiday would have an impact on the trading performance of the Company. The Company would also provide its FY21 assessment of the housing market with its FY20 results. The Group had continued to trend better than 90% of the HBF survey five-star threshold since January 2020.
