


Summary
- Paragon Banking Group Plc had reported a marginal reduction of 1% in its revenue during FY20 ended on 30 September 2020.
- The specialist buy-to-let volumes were declined by £110.8 million to £298.7 million during Q1 FY21.
- The net loan balances stood at £12.67 billion as of 31 December 2020.
- Total advances had declined to £521.8 million during Q1 FY21.
Paragon Banking Group Plc (LON:PAG) is the LSE listed financial stock. The Company is the leading provider of financial services. PAG’s shares have generated a return of about negative 12.68% in the last 12 months. The Company has been listed on FTSE 250.
The Company will release half-year FY21 results for the six months ending 31 March 2021 on 08 June 2021.
Business Model
The Company is the leading UK-based specialist bank, engaged in providing lending products for landlord mortgages and business customers loans. PAG was founded in 1985 and had around 1,400 people.
The Company has four reportable business segments: Mortgage Lending, Commercial Lending, Idem Capital and Savings.
(Source: Company website)
Q1 FY21 Trading Update (for three months from 01 October 2020 to 31 December 2020, as on 29 January 2021)
- The Company had provided a resilient financial performance on the expected lines during Q1 FY21 compared to the similar period of the prior year.
- The specialist buy-to-let volumes were dropped by £110.8 million to £298.7 million during Q1 FY21 compared to Q1 FY20 reflecting the adverse impact of lockdowns.
- Total advances had declined to £521.8 million during Q1 FY21. while it was £684.9 million during Q1 FY20.
- The net loan balances stood at £12.67 billion as of 31 December 2020.
- The buy-to-let pipeline had jumped by £152.8 million for Q1 FY21 from the levels of Q1 FY20 and reached £966.8 million.
- The pipeline had anticipated acceleration during Q2 FY21 due to the completions arising from stamp duty changes for Q2 FY21.
- The Company had demonstrated a decline in redemptions of 21.5% to £169.2 million and would remain below historical averages.
- The commercial lending volume had shown a robust growth to £217.7 million during the period driven by the strong performance of the new business pipeline.
- The SME lending had witnessed a growth in Q1 FY21 compared to the levels of Q4 FY20 due to significant lending as a part of CBILS and BBLS schemes.
- The payment holidays had been given on around £2.6 billion of balance as of March 2020. However, it had improved and stood at £104.6 million as of 31 December 2020.
- The deposit balances had increased to £8.6 billion during Q1 FY21.
- The portfolio average deposit rate stood at 1.22% as of 31 December 2020 compared to 1.34% as of 30 September 2020.
- The Group had reported its unverified CET1 and total capital ratios to be around 15.1% and 17.3% respectively as of 31 December 2020.
Recent News
On 22 January 2021, the Company had published its Pillar III Disclosures for the year ended 30 September 2020.
FY20 Financial Highlights (for twelve months period ended 30 September 2020, as on 03 December 2020)
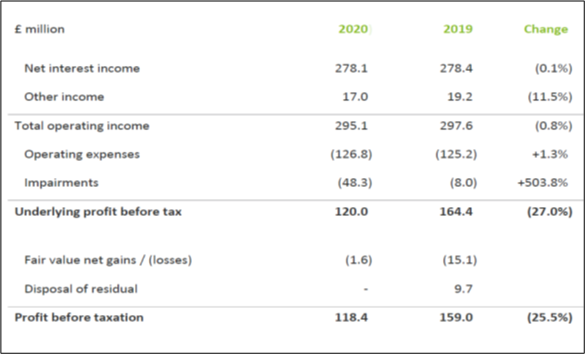
(Source: Company result)
- The Company’s total operating income had witnessed a marginal decline of 0.8% to £295.1 million for FY20, while it was £297.6 million during FY19.
- The underlying profit before tax and profit before taxation had demonstrated a significant decline of 27.0% and 25.5%, respectively during the period.
- The Company had declared a final FY20 dividend of 14.4 pence per share with subject to approval at the AGM on 24 February 2021. The dividend cover for FY20 had reached 2.50x compared to 2.33x during FY19.
- Fitch Ratings had downgraded its senior unsecured debt rating to BBB- from BBB and the rating of the £150.0 million Tier 2 Bond to BB+.
- The Company had generated £1,924.6 million of cash during FY20, while it was £1,224.4 million during FY19.
FY20 Operational Highlights (as on 03 December 2020)
- The buy-to-let advances had declined from £1,315.1 million during FY19 to £1,119.0 million during FY20.
- The buy-to-let business pipeline had reached £868.1 million as of 30 September 2020, while it was £789.8 million as of 31 March 2020.
- The development finance leading advances had surged to £385.3 million as of 30 September 2020 due to strong pipeline facilities.
- The retail deposits grew by 22.9% from £6,391.9 million for FY19 to £7,856.6 million for FY20.
- The Company had accessed £910.0 million under the SME Term Funding Scheme as of 30 September 2020.
- The Company had reported 0.15% reduction in buy-to-let 3-month plus arrears during FY20.
Key Performance Indicators
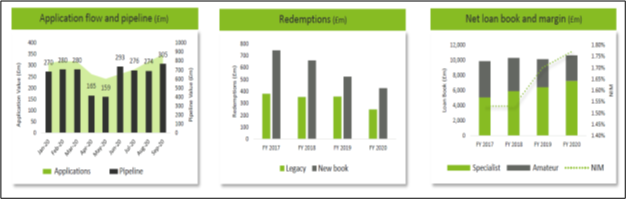
(Source: Company presentation)
Share Price Performance Analysis of Paragon Banking Group Plc
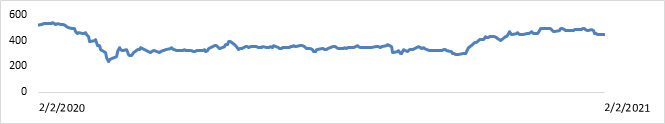
(Source: EODHD/Others, chart created by Kalkine group)
Shares of Paragon Banking Group Plc were trading at GBX 448.60 and were up by close to 0.20% against the previous closing price as on 02 February 2021, (before the market close at 09:08 AM GMT). PAG's 52-week Low and High were GBX 217.00 and GBX 544.00, respectively. Paragon Banking Group Plc had a market capitalization of around £1.15 billion.
Business Outlook
The Company had shown financial and operational resilience during FY20 in its business model. The Company is well-positioned to tackle existing business challenges driven by its credit defensive balance sheet. The capital ratio and liquidity were proven to be robust throughout 2020. The Company remained well-aware of the uncertainty to be persisted during FY21 as well. However, the Company had delivered an encouraging Q1 FY21 performance.
