


Summary
- Dunelm Group's sales declined by 3.9 percent year on year to £1,057.9 million in FY2020.
- The online sales increased by 50.5 percent year on year, whereas like for like store sales fell by 12.7 percent year on year in FY2020.
- Dixons Carphone's Electricals sale increased by 14 percent year on year for 17 weeks ended 29 August 2020. The online platform supported the sales as it grew by 124 percent year on year.
- The online business contributed 42 percent of the total sales during the 17 weeks.
Based on 1-year performance, shares of Dunelm Group PLC (LON:DNLM) were up by close to 70.48 percent, whereas shares of Dixons Carphone PLC (LON: DC.) were down by around 24.56 percent. DNLM and DC. was up by around 5.44 percent and 1.93 percent, respectively from the previous closing price (as on 11 September 2020, before the market close at 1:00 PM GMT+1).
Dunelm Group PLC (LON:DNLM) - Strong recovery since stores reopened
Dunelm Group PLC is a UK based company that sells home furnishing products. The homewares retailer operates 170 superstores and two high street stores. The Company has close to 30,000 products in stores and 50,000 products listed online.
FY2020 results (ended 27 June 2020) as reported on 10 September 2020
(Source: Company website)
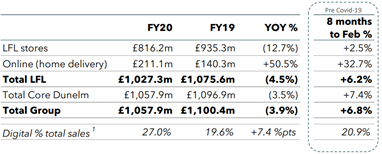
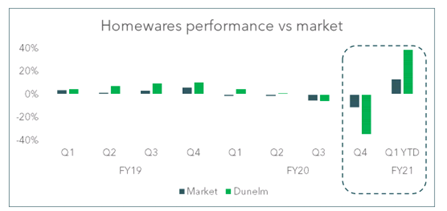
In FY2020, the Company generated sales of £1,057.9 million, which declined by 3.9 percent year on year from £1,100.4 million in FY19. However, the total sales grew by 6.8 percent year on year for eight months until February 2020. The digital sales underpinned the performance in the second half of the year as stores were closed. The online sales increased by 50.5 percent year on year in FY20 and surged by almost 105.6 percent year on year in the last quarter of FY20. Online sales increased to £211.1 million in FY20 from £140.3 million in FY19. The like for like store sales fell by 12.7 percent year on year to £816.2 million in FY20 from £935.3 million in FY19. The Company reported gross profit of £532.4 million in FY20 lower than £545.6 million reported in FY19. The gross margin improved by 0.7 percent as compared to FY19 due to a decline in product markdown and sourcing gain. The operating profit fell by 2.7 percent year on year to £112.8 million in FY20 from £116.0 million generated in FY19. The earnings per share were 43.4 pence in FY20. Dunelm Group generated free cash flow of £174.7 million in FY20 that was better than free cash flow of £152.8 million generated in FY19. The free cash flow in FY20 was supported by deferred VAT payment and delay in a stock purchase. The Company did not propose a final dividend for FY20.
FY2020 Financial Performance
(Source: Company website)
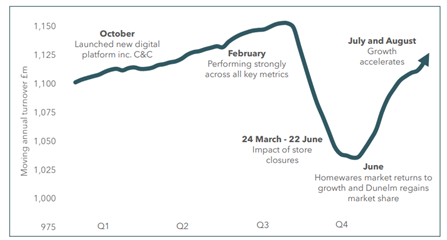
Performance post-reopening of stores
(Source: Company website)
The online sales have increased by around 130 percent in the first nine weeks of FY21. The total sales in July 2020 and August 2020 increased by 59 percent and 24 percent, respectively year on year. The sales were supported by reopening of stores and summer sale. After the reopening of stores, Dunelm Group noticed that the conversion rate and average basket size of the customers have increased. The customer conversion on the website has increased, but the average value of the basket fell. Customers are moving to stores for the purchase of higher-value goods such as furniture. The performance of home office furniture, dining furniture, lighting and wallpaper was steady.
Share Price Performance Analysis
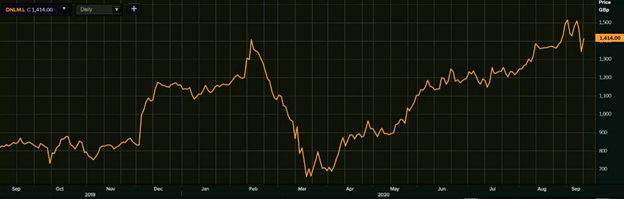
1-Year Chart as on September-11-2020, before the market close (Source: EODHD/Others, Thomson Reuters)
Dunelm Group PLC's shares were trading at GBX 1,414.00 and were up by close to 5.44 percent against the previous closing price (as on 11 September 2020, before the market close at 1:00 PM GMT+1). DNLM's 52-week High and Low were GBX 1,558.63 and GBX 596.50, respectively. Dunelm Group had a market capitalization of around £2.71 billion.
Business Outlook
The Company witnessed strong demand for the first two months of FY21, but the future consumer demand remains highly uncertain. The Company is among the top players in the UK homewares segment, and thus it is confident over its ability to gain the market share. Given there is no future lockdown, the Company expects its gross margin in FY21 to remain the same as that in FY20. It would focus on digital channel and supply chain management to drive growth.
Dixons Carphone PLC (LON: DC.) - Consumer spending to remain subdued in the remaining of 2020
Dixons Carphone PLC is a UK based company that sells consumer electronics and mobile phones. The Company has 18 brands and runs 932 stores in eight countries. It operates in the UK, Ireland, Nordics and Greece, and own brands such as Curry PC World, Carphone Warehouse and iD Mobile. Dixons Carphone is listed on the FTSE-250 index.
Trading update (for 17 weeks ended 29 August 2020) as reported on 10 September 2020
(Source: Company website)
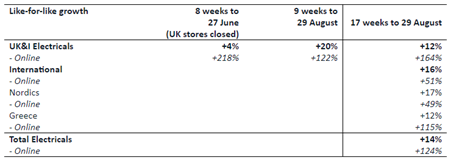
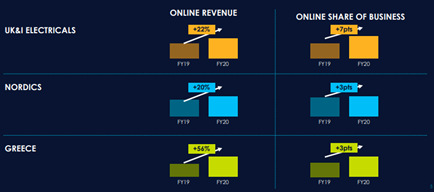
Dixons Carphone's Electrical sales increased by 14 percent year on year for 17 weeks ended 29 August 2020. The online Electrical sales increased by 124 percent year on year. The like for like Electrical sales in the UK & Ireland increased by 12 percent year on year and the International sales increased by 16 percent year on year. Electrical sales in Nordics and Greece increased by 17 percent and 12 percent, respectively year on year. Mobile revenue in the UK & Ireland fell by 56 percent year on year as the sales were impacted due to close down of standalone stores. The online sales have supported the trading activity of the Company. The online marketplace is gaining share in the total share of the Company. Online share of the business was 42 percent during the reported period in FY21, and it increased from 21 percent for 17 weeks last year. The growth in sales is recovering since the stores have reopened.
Impact of Lockdown on Sales
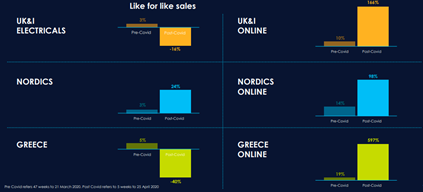
(Source: Company website)
FY2020 results (ended 2 May 2020) as reported on 15 July 2020
In FY20, the Company reported revenue of £10,170 million, which fell by 3 percent year on year from £10,433 million in FY19. Electrical segment revenue was £8,581million, and UK & Ireland Mobile segment revenue was £1,589 million in FY20. Electricals revenue increased by 2 percent year on year, whereas UK & Ireland Mobile division revenue declined by 20 percent year on year in FY20. The Company reported profit before tax of £166 million in FY20, which fell from £339 million a year ago. The Company generated free cash flow of £109 million in FY20.
Increasing Share of Online Business in FY2020
(Source: Company website)
Share Price Performance Analysis
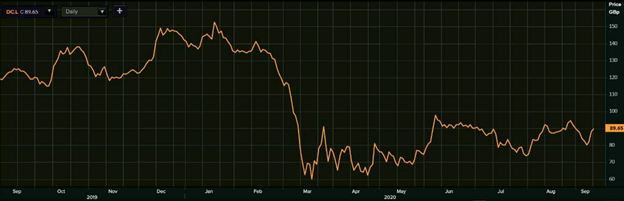
1-Year Chart as on September-11-2020, before the market close (Source: EODHD/Others, Thomson Reuters)
Dixons Carphone PLC's shares were trading at GBX 89.65 and were up by close to 1.93 percent against the previous closing price (as on 11 September 2020, before the market close at 1:00 PM GMT+1). DC.'s 52-week High and Low were GBX 166.45 and GBX 53.50, respectively. Dixons Carphone had a market capitalization of around £1.03 billion.
Business Outlook
The Company witnessed resilient trading conditions since the stores have reopened. It is confident that its liquidity headroom, supply chain management and market leadership is supportive in the current challenging conditions. However, the Company expects weakening in consumer spending in the reaming of 2020. Dixons Carphone is looking to list minority stake of its Nordic Business in 2021.
