


Newriver REIT Plc
Newriver REIT Plc (NRR) is a leading real estate investment trust company. It is involved in the real estate business throughout the United Kingdom. The Group focuses on managing, buying, developing and recycling convenience-led, leisure assets and community-focused retail. The Company's business is differentiated in two segments, being an investment in pubs and retail property. The Company manages or owns a portfolio of around 34 shopping centres and 23 retail parks with retail and mixed-use development prospects and an array of high street retail assets.
NRR-Recent News
On 17th October 2019, the company announced the acquisition of Poole Retail Park successfully in association with BRAVO Strategies III LLC for a total consideration of £44.7 million. The company is expecting a net initial yield of 8 per cent. The company holds a 10 per cent interest with a share of £4.5 million in the asset. Furthermore, the company will act as an asset manager and will be eligible for a management fee which will be calculated based on gross rental income generated by the asset and overall performance. The company will announce its interim results for the period ending 30th September 2019 on 21st November 2019. The company has declared a quarterly dividend of 5.4 pence per share for Q2 FY20, which will be paid as PID (Property Income Distribution) on 15th November 2019. The stockâs ex-dividend date was 17th October 2019.
NRR-Trading Update: Q1 FY20
During the quarter under consideration, the RIET group disposed an asset worth £27.5 million at a blended net yield of 6.7 per cent and 1.6 per cent below the book value of the asset, including an Asda food store and petrol filling station, one shopping centre, six c-stores and three pubs and deployed proceeds into acquisition in BRAVO JV of four retail parks.
Retail occupancy stood high at 95.4 per cent against 95.2 per cent in Q4 FY19, and average retail rent remained stable at £12.58 per sq. ft against £12.52 per sq. ft. However, the Group's well-positioned asset portfolio stood robust to CVAs and administration during the quarter at 0.5 per cent of the gross income. However, on a like-for-like basis, footfall across the shopping centres narrowed by 2.5 per cent but was still 70 basis points higher against the UK benchmark.
However, Group's community pub asset portfolio handed a like-for-like EBITDA per pub of 5.5 per cent in Q1FY20, and occupancy remained steady at 97.6 per cent against the occupancy of 97.9 per cent reported in the quarter ended March 2019.
The Groupâs ordinary dividend stood at 5.4 pence per share, and it was flat against the Q1 FY19 interim dividend of 5.4 pence per share.
NRR-Share price performance
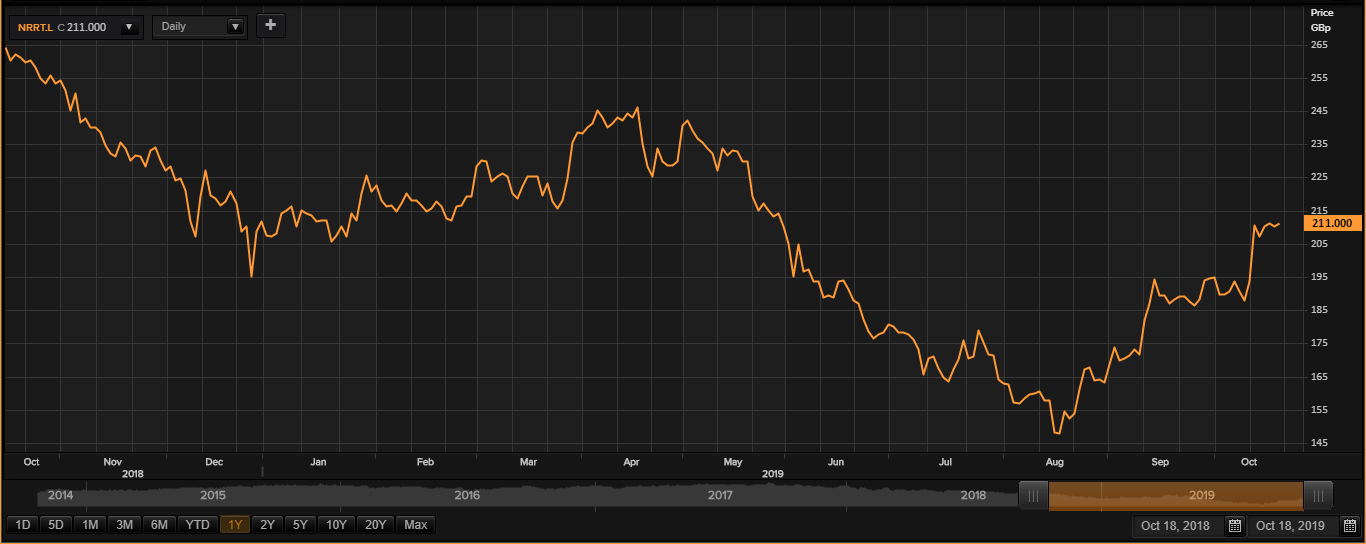
At the time of writing (18/10/19 before the market close, at 10:53 AM GMT), shares of the NRR were trading at GBX 211 and surged by 0.47 per cent against the previous closing price.
Volume Summary
The 5-day average daily shares that exchanged hands stood at 1,575,208.60, which was around 43.13 per cent above the 30-day average daily volume (1,100,539.63) that exchanged hands at the London Stock Exchange. The dayâs volume in the stock stood at 120,719 with 87 trades taking place at the London Stock Exchange (before the market close).
52wk H/L range
In the past 52-wks, shares of the NRR have registered a high price of GBX 263.30 and a low price of GBX 143.20, and at the current trading level, as quoted in the price chart, shares were quoting around 47.34 per cent above the 52w low price level.
Price Performance (%)
On a YoY basis, shares of the NRR have delivered a negative price return of 20.45 per cent and the benchmark index by approximately 21.87 per cent down over the same period. However, on a year-to-date basis, the stock has recorded a negative price return of approximately 0.71 per cent and was up by around 10.99 per cent in the past one month.
Simple Moving Average (SMA)
From the Simple Moving Average standpoint, shares were quoting above the 200-day simple moving average price and quoting above its 60-day and 30-day SMA prices as well.
Relative Strength Index (RSI)
The 30-day and 14-day relative strength index were hovering at 63.07 and 69.75, respectively.
Mediclinic International Plc
Mediclinic International Plc (MDC) is Stellenbosch, South Africa-headquartered, an international private healthcare services group. As on February 15, 2016, its shares got admitted to the main market of the London Bourse.
MDC-Trading Update for H1 FY20
In the exchange filing made by the company with LSE, the healthcare equipment & services provider reported its trading update for the first half of the FY20 ended as on September 30, 2019. During the period under review, the group's revenue grew by 6.5 per cent at a constant currency basis, and on a reported basis, the group's revenue grew by 9 per cent. Pre-IFRS16 the group's EBITDA increased by 5 per cent and the IFRS EBITDA Margin for the six-month under review was at 16.5 per cent.
Also, the company holds a 29.9 per cent interest in the LSE listed Spire Healthcare Group, which reported IFRS16 profit for the H1 FY20 at £7.1 million. Mediclinic's H1 FY20 equity-accounted, the share of profit from Spire amounting to £2.1 million.
The company possesses weak fundamentals, negative Return on Equity and higher Balance Sheet risk. Despite a moderate performance recorded by the group in the first half of the FY20, the group's performance is still quite below the average industry performance. With a lower gross margin of 37.7 per cent against the industry average of 53.4 per cent, negative operating margin whereas industry average operating margin stood at 7.9 per cent, negative Return on Equity, whereas industry median stood at 4.7 per cent. Also, the Long-term Debt/Equity ratio of the company at the end of FY19 stood at 36.1 per cent, 170 basis points higher against the industry median of 34.4 per cent. This reflects a higher balance sheet risk for the company even though the group is not generating income at the bottom level.
MDC-Financial highlights for FY19
The companyâs revenue stood at £2,932 million in the fiscal year 2019. The companyâs EBITDA adjusted was recorded at £493 million in the financial year 2019 factoring the regulatory changes which created an impact on Hirslanden. The companyâs operating profit (adjusted) stood at £330 million. In line with the expectations, the companyâs earnings per share (adjusted) stood at 26.9p/share. The cash conversion rate of the company was 91% of EBITDA (adjusted) in the financial year 2019. The company proposed a final dividend of 4.70p/share in the financial year 2019. The companyâs total dividend was recorded at 7.90p/share in the financial year 2019.
MDC-Share price performance
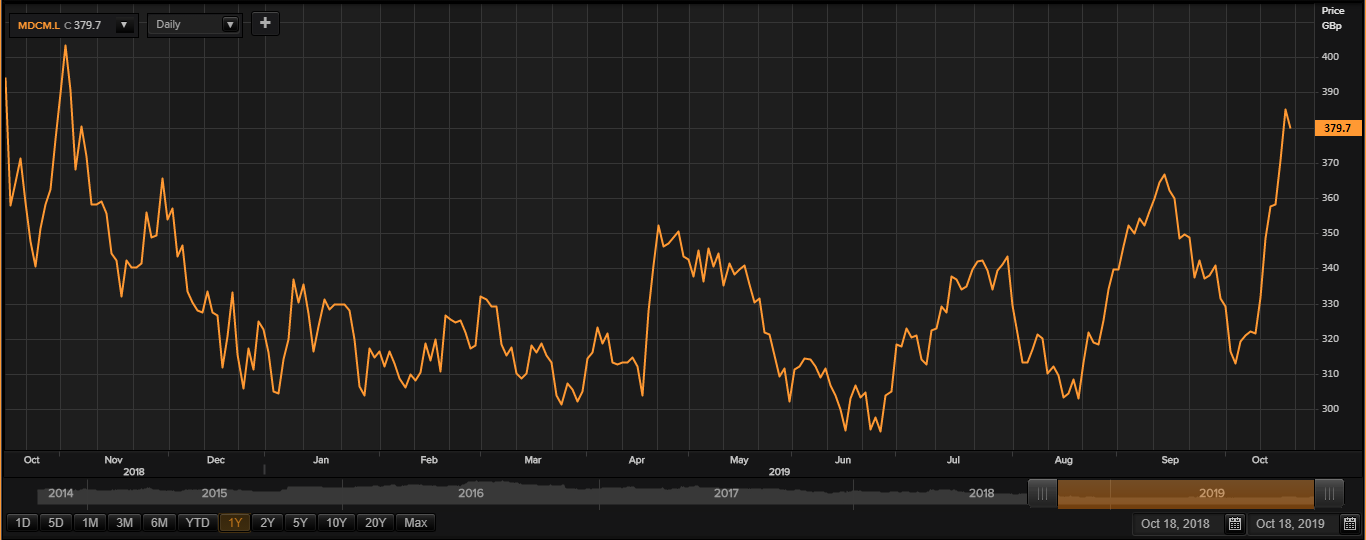
At the time of writing (18/10/19 before the market close, at 11:03 AM GMT), shares of the MDC were trading at GBX 379.7 and declined by 1.29 per cent against the previous closing price.
Volume Summary
The 5-day average daily shares that exchanged hands stood at 1,888,236.20, which was around 77.73 per cent above the 30-day average (1,062,386.13) daily volume that exchanged hands at the London Stock Exchange. The dayâs volume in the stock stood at 248,160 with 633 trades taking place at the London Stock Exchange (before the market close).
52wk H/L range
In the past 52-wks, shares of the MDC have registered a high price of GBX 414 and a low price of GBX 288.30, and at the current trading level, as quoted in the price chart, shares were quoting around 31.70 per cent above the 52w low price level.
Price Performance (%)
On a YoY basis, shares of the MDC have delivered a negative price return of 2.31 per cent and the benchmark index by approximately 4.05 per cent down over the same period. However, on a year-to-date basis, the stock has recorded a price return of approximately 19.35 per cent and was up by around 7.04 per cent in the past one month.
Simple Moving Average (SMA)
From the Simple Moving Average standpoint, shares were quoting above the 200-day simple moving average price and quoting above its 60-day and 30-day SMA prices as well.
Relative Strength Index (RSI)
The 30-day and 14-day relative strength index was hovering at 65.14 and 74.88, respectively.
