
.jpg)


Centamin PLC
Dual-listed company, Centamin Plc  (LON:CEY), with listings on the London Stock Exchange and Toronto Stock Exchange is involved in exploration, development and mining. The company started its production in the year of 2009 in Egypt and possesses a principal asset of the Sukari Gold Mine. The company currently produces 500,000 ounces of gold every year and has plenty of potentials to do further better this. The company is backed by robust financial management, possesses workforce enriched in domain expertise followed by strict supervision for its operations to create value for all its stakeholders. The company is comfortable with the acquisition and development of gold projects as it has the domain expertise, sound financial health and growth potential.
CEY-Q4 Outlook
The production in October till date was in line with the expectations and the production guidance at the bottom end of full-year, 490,000 ounces, remains the target for the year. Due to improved gold sales and reduced costs, strong free cash flow generation is expected in the fourth quarter. The company is expected to release its results in the fourth quarter on 15th January 2020.
 CEY-Business performance for FY19 1H
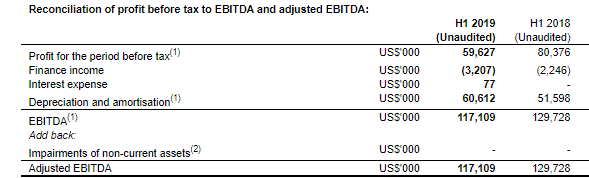
(Source: Companyâs filings, London Stock Exchange)
The gross revenue of the company decreased by 3 per cent to US$292.4 million for the six months ended 30 June 2019 in contrast to the corresponding period of the last year. Profit before tax stood at US$59.6 million in H1 FY19, a decrease of 26 per cent against the same period in 2018.  In H1 FY2019, net revenue from gold and silver sales stood at US$288.1 million, a decrease of 3 per cent against the same period in 2018, excluding US$4.7 million produced in pre-production revenue from Cleopatra development in mineralisation. In the first half of 2019, the operating cash flow and adjusted free cash flow decreased by 5 per cent and 1 per cent to US$116.4 million and US$35.7 million respectively as compared with the corresponding period of the last year. Cash cost of production stood at US$692 per ounce generated in the first half of 2019. All-in sustaining cost ("AISC") increased by 1 per cent to US$940 per ounce sold against the US$930 per ounce in H1 FY18. EBITDA reduced by 10 per cent to US$117.1 million in H1 FY19 as compared to US$129.7 million in H1 FY18, while EBITDA margin stood at 41 per cent. Basic EPS declined by 52 per cent to 1.71 cents against the 3.57 cents in H1 FY18. The groupâs board declared an interim dividend per share of 4 cents.
CEY-Stock price performance
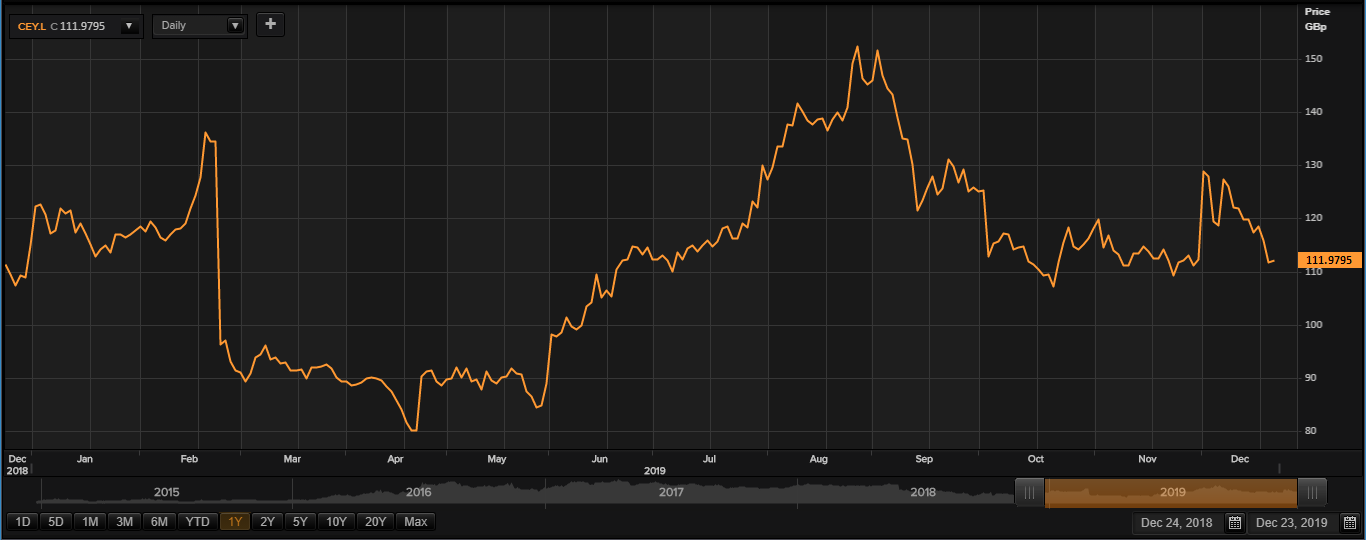
(Source: Thomson Reuters) Daily Chart as on Dec-23-19, before the LSE market close
While writing (as on 23rd December 2019, at 09:04 AM GMT), Centamin PLCâs shares were trading at GBX 111.97 per share; which were 0.29 per cent up in comparison to the previous day closing price level. The total market capitalisation of the group at the time of writing was hovering around £1.29 billion.
The shares of the Centamin PLC have struck a high of GBX 154.75 (as on August 28, 2019) and a low of GBX 79.14 (as on April 18, 2019) in the last twelve months. At the current price point, as quoted in the price chart, the companyâs shares were trading 27.64 per cent below the high price point attained in the last twelve months and 41.48 per cent above the low price point attained in the last twelve months.
At the time of writing, the stock's average daily traded volume for 5 days was 5,998,477.00; 30 days- 5,337,315.20 and 90 days â 6,217,557.41. The companyâs stock beta (5Y monthly) stood at 1.01, which implies that the companyâs stock is almost as volatile as the benchmark index along with a dividend yield of 5.14 per cent.
The shares of the company were trading below the 30-days and 60-days SMA while writing. The stockâs daily average traded volume for 5 days surged by 12.39 per cent in contrast to 30 days daily average traded volume.
On a YTD (Year-to-Date) time interval, the shares of Centamin PLC surged by approximately 2.62 per cent and were down by 11.11 per cent in the last quarter. However, Centamin PLCâs shares have delivered a 0.58 per cent negative return in the last one-month period.
Ferrexpo PLC
Swiss iron ore mining company, Ferrexpo Plc (LON:FXPO) is involved in the production, processing and export of iron ore pellets. The company is in the business of processing, mining and selling top-notch iron ore pellets to the worldwide steel industry for more than 40 years. Ferrexpo also carries out ore processing and logistics operations. The companyâs assets are situated in the Poltava region of Ukraine. The company serves customers in Europe and Asia, including Slovakia, Austria, China, South Korea, Germany, Czech Republic, Taiwan, Turkey, Vietnam and Japan.
FXPO-Recent News
With reference to the announcement made by the company on 14th November 2019, Mr. Roman Palyvoda will serve as Acting Chief Financial Officer of the company with immediate effect.
FXPO-Business performance for FY19 1H
In the first half of the financial year 2019, the companyâs sales volume increased by 4 per cent to 4,990 kt as compared with the corresponding period of the last year. The groupâs reported revenue increased by 28 per cent to US$787 million as compared to US$617 million in H1 FY18, reflecting a surge in sales volumes and higher iron ore fines prices. The underlying EBITDA rose by 59 per cent to US$372 million against the previous year same period data, due to an increase in sales volumes. Profit after tax for the period increased by 78 per cent to US$270 million against US$152 million in H1 FY18, driven by lower interest expense and higher profit before tax and finance. Basic earnings per share (EPS) increased to US 45.9 cents as compared to US 25.9 cents in H1 FY18. The interim declared dividend per share rose by 100 per cent to US 6.6 cents.
FXPO-Stock price performance
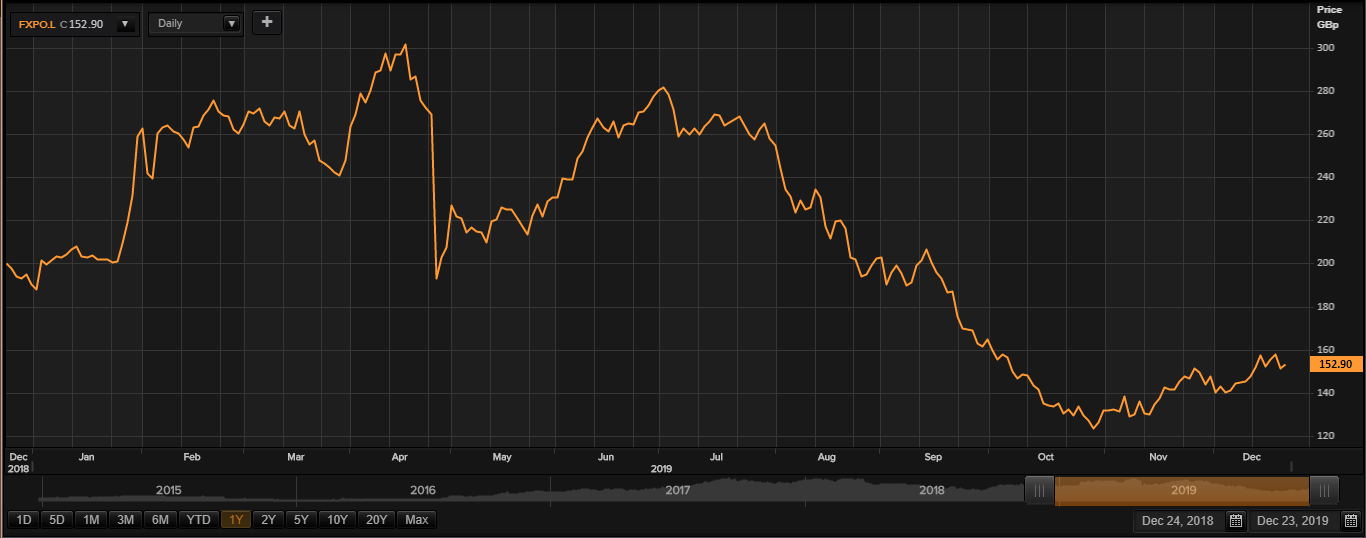
(Source: Thomson Reuters) Daily Chart as on Dec-23-19, before the LSE market close
While writing (as on 23rd December 2019, at 09:32 AM GMT), Ferrexpo PLCâs shares were trading at GBX 152.90 per share; which were 1.12 per cent up in comparison to the previous day closing price level. The total market capitalisation of the group at the time of writing was hovering around £890 million.
The shares of the Ferrexpo PLC have struck a high of GBX 304.57 (as on April 16, 2019) and a low of GBX 119.85 (as on October 31, 2019) in the last twelve months. At the current price point, as quoted in the price chart, the companyâs shares were trading 49.80 per cent below the high price point attained in the last twelve months and 27.58 per cent above the low price point attained in the last twelve months.
At the time of writing, the stock's average daily traded volume for 5 days was 3,795,119.80; 30 days- 2,672,198.87 and 90 days â 2,710,901.67. The companyâs stock beta (5Y monthly) stood at 1.73, which implies that the companyâs stock is more volatile in comparison to the benchmark index along with a dividend yield of 7.22 per cent.
The shares of the company were trading above the 30-days and 60-days SMA while writing. The stockâs daily average traded volume for 5 days plunged by 15.02 per cent in contrast to 30 days daily average traded volume.
On a YTD (Year-to-Date) time interval, the shares of Ferrexpo PLC plunged by approximately 22.32 per cent and were down by 19.06 per cent in the last quarter. However, Ferrexpo PLCâs shares have delivered 7.01 per cent positive return in the last one-month period.
