


British Land Company PLC (LON:BLND)
London-headquartered property company, British Land Company PLC focuses on creating mixed-use places. The real estate group is engaged in owning, managing, developing and financing a portfolio of commercial properties, focused on retail locations around the country and rising multi-use places in London. The operations of the group are differentiated in four operating segments, namely Offices, Retail, Canada Water and Other/unallocated.
BLND-Business performance for H1 FY2020 period ended 30th September 2019
The companyâs underlying profit was down by 10.1 per cent at £152 million in the first half of the fiscal year 2020 from £169 million in the first half of the fiscal year 2019. The net rental income of the company declined by £24 million in the first half of the financial year 2020 to £243 million as against £267 million in the first half of the financial year 2019.
The underlying EPS of the group was reported at 16.1 pence in the first half of the fiscal year 2020 versus 17.2 pence in the first half of the fiscal year 2019, a decline of 6.4 per cent from the previous year. The company reported a loss before taxation based on IFRS of £404 million in the first half of the fiscal year 2020, in contrast to a loss before taxation of £48 million in the first half of the fiscal year 2019.
In the first half of the financial year 2020, the reported IFRS basic loss per share stood at 42.9 pence versus IFRS basic loss per share of 4.9 pence in the first half of the fiscal year 2019. The companyâs dividend per share was up by 3 per cent to 15.97 pence in the first half of the financial year 2020 versus 15.50 pence in the first half of the fiscal year 2019.
In the first half of the financial year 2020, IFRS net assets declined to £7,971 million from £8,689 million in the same period the previous year, while the loan to value surged to 30.8 per cent in the first half of the fiscal year 2020 from 28.1 per cent in the first half of the fiscal year 2019.
BLND-Stock price performance
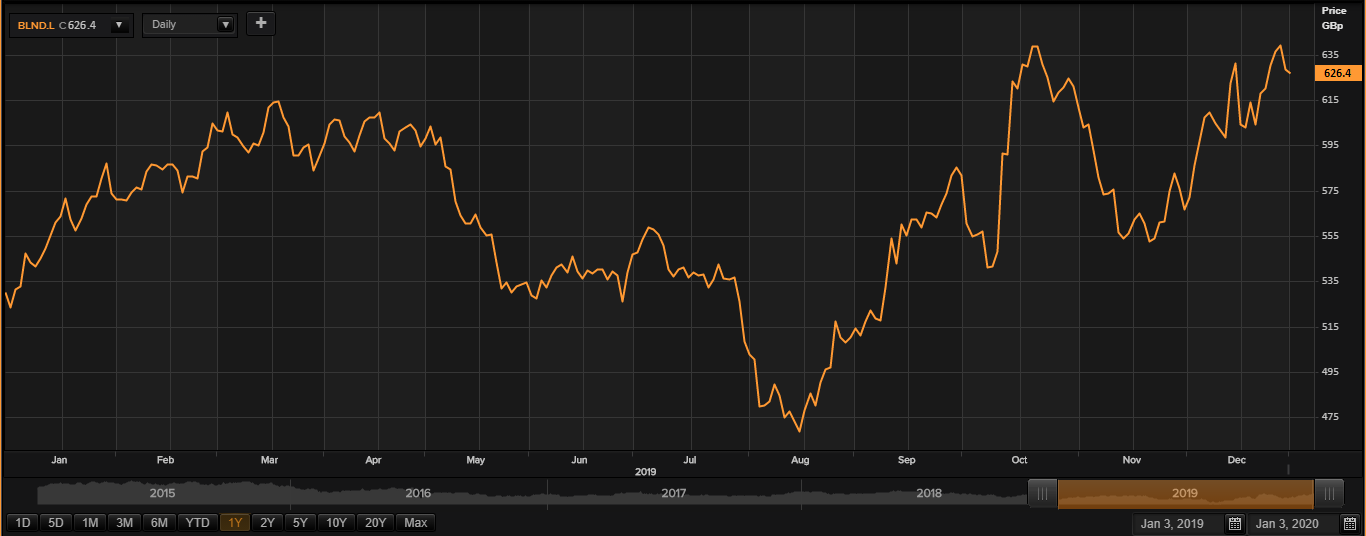
(Source: Thomson Reuters) Daily Chart as on Jan-03-20, before the LSE market close
While writing on 03rd January 2020, at 12:55 PM Greenwich Mean Time, the market capitalisation of the group was hovering around £5.87 billion.
While writing British Land Company PLCâs shares were trading at GBX 626.60 per share; which were down by 0.25 per cent, in comparison to the previous day closing price level.
The shares of the British Land Company PLC have struck a low of GBX 465.30 (as on 15th August 2019) and a high of GBX 649.40 (as on 22nd October 2019) in the last twelve months. At the current price point, as quoted in the price chart, the companyâs shares were trading 34.67 per cent above the low price point attained in the last twelve months and were trading 3.51 per cent below the high price point attained in the last twelve months.
At the time of writing, the stock's average daily traded volume for 5 days was 2,349,093.20; 30 days- 3,696,879.20 and 90 days â 3,944,327.91. The stockâs 5-day daily average traded volume plunged by 36.46 per cent in contrast to stockâs 30-day daily average traded volume. At the time of writing, the shares of the company fared above the 30-days and 60-days simple moving averages.
On a YTD (Year-to-Date) time interval, the shares of British Land Company PLC plunged by approximately 1.66 per cent and were up by 12.14 per cent in the last quarter. In the last one-month period, British Land Company PLCâs shares have generated a positive return of 10.91 per cent.
Â
Next PLC (LON:NXT)
UK based international clothing, home products, accessories and footwear retailer, Next PLC is a group, which offers products through brick and mortar stores, online services as well as mail-order operations. The group has differentiated its operations in seven operating segments being Retail, Online, International Retail, Sourcing, Finance under the brand name NEXT, Lipsy and Other.
NXT-Q4 Trading statement
The company released its trading statement for the fourth quarter on 3rd January 2020. The company increased its full-year profit guidance by £2 million to £727 million, which represents an increase of 0.6 per cent on last year along with an EPS growth of 5.4 per cent. The companyâs full price sales were up by 3.9 per cent as compared to last year, on year to date basis. The companyâs Q4 full price sales were ahead of the companyâs expectations. The companyâs outlook for the full price sales is expected to be up by 3 per cent and profit to be up by 1 per cent for the year ending January 2021.
NXT-Business performance for H1 FY20 period ended 27th July 2019
The companyâs revenue surged by 2.7 per cent to £2,014.5 million in the first half of the financial year 2020 from £1,961.9 million in the first half of the fiscal year 2019. The increase in the revenue can be attributed to the sales growth from retail and online businesses during the period. The groupâs gross profit surged to £764.9 million in the first half of the fiscal year 2020 from £713 million in the first half of the fiscal year 2019. The PBT (Profit before tax) of the company surged by 4 per cent from £314.9 million in the H1 FY2019 to £327.4 million in H1 FY2020.
The PAT (Profit after tax) was up by 3.9 per cent from £257.3 million in the H1 FY2019 to £266.9 million in H1 FY2020. In H1 FY2020, the trading profit surged from £368.9 million in the H1 FY2019 to £380.7 million. The companyâs operating profit surged to £380.8 million in H1 FY2020 from £369 million in the H1 FY2019. The companyâs underlying PBT (profit before tax) increased by 2.7 per cent to £319.6 million in H1 FY2020 from £311.1 million in the H1 FY2019.
The companyâs underlying earnings per share increased by 7.5 per cent to 199.5 pence in H1 FY2020 from 185.6 pence in the H1 FY2019. The companyâs basic earnings per share surged by 8.8 per cent to 204.4 pence in H1 FY2020 from 187.9 pence in the H1 FY2019. The companyâs ordinary dividend per share was up by 4.5 per cent to 57.5 pence in H1 FY2020 from 55 pence in the H1 FY2019.
NXT-Stock price performance
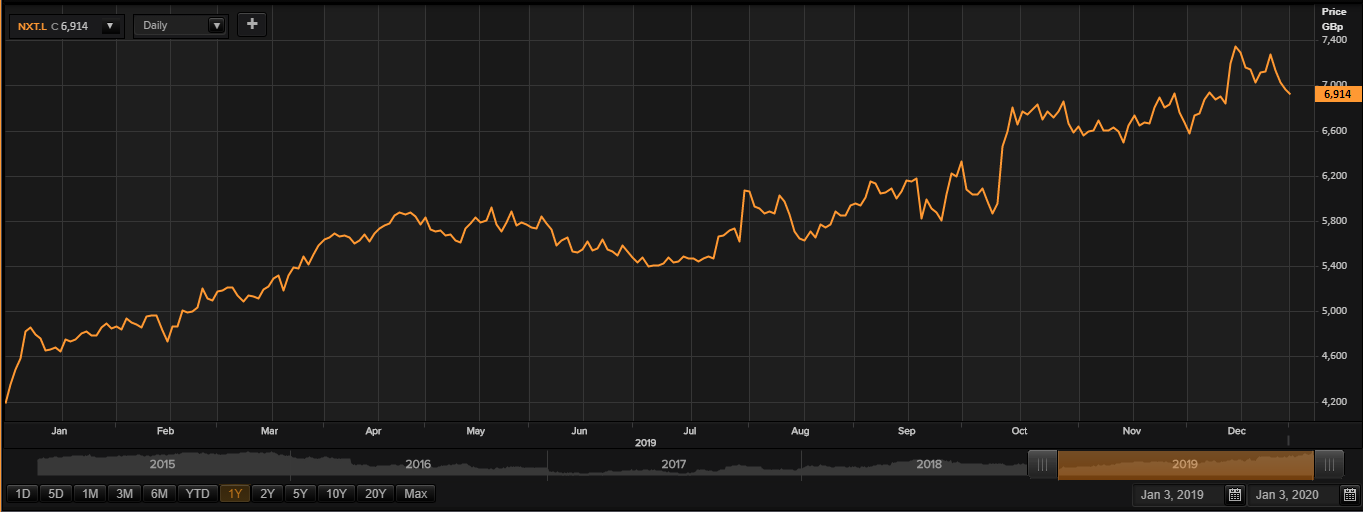
(Source: Thomson Reuters) Daily Chart as on Jan-03-20, before the LSE market close
While writing on 03rd January 2020, at 01:00 PM Greenwich Mean Time, the market capitalisation of the group was hovering around £9.35 billion.
While writing, Next PLCâs shares were trading at GBX 6,914.00 per share; which were down by 0.63 per cent, in comparison to the previous day closing price level.
The shares of the Next PLC have struck a low of GBX 4,301.00 (as on 03rd January 2019) and a high of GBX 7,358.00 (as on 16th December 2019) in the last twelve months. At the current price point, as quoted in the price chart, the companyâs shares were trading 60.75 per cent above the low price point attained in the last twelve months and were trading 6.03 per cent below the high price point attained in the last twelve months.
At the time of writing, the stock's average daily traded volume for 5 days was 235,264.20; 30 days- 413,756.00 and 90 days â 445,676.92. The stockâs 5-day daily average traded volume plunged by 43.14 per cent in contrast to stockâs 30-day daily average traded volume. At the time of writing, the shares of the company fared above the 30-days and 60-days simple moving averages.
On a YTD (Year-to-Date) time interval, the shares of Next PLC plunged by approximately 0.85 per cent and were up by 14.63 per cent in the last quarter. In the last one-month period, Next PLCâs shares have generated a positive return of 4.41 per cent.
