


Studio retail Group Plc
Studio Retail Group Plc (LON: STU) is an Accrington, United Kingdom domiciled General retailing organisation, which was previously also called Findel Plc. The company has been in operation since 1955 and has majorly been involved in the distribution and supply towards UK Schools for equipment. The company is currently responsible for a delivery of around 9 million parcels annually across the country. The company has 2 major operating divisions, which are, Studio division, which operates by providing shopping services to around 1.9 million consumers of the companyâs products, and acts as one of the leading digital value retailers in the country. The other one is  the Findel Education division, which operates as the leading independent distributor of various equipment and resources required in schools and educational institutions in the United Kingdom as well as in other countries.
STU Financial Performance
On 16th December 2019, the company issued a Press release to produce its interim results for the 26 weeks ended on 27th September 2019. The companyâs main highlighting point in terms of the results was the record sales achieved by the Studio division during the period. The total group revenue showed no change Year on Year and was reported to be at £228.1 million during the period. The revenue from continuing operations was reported to have increased marginally by 0.3 per cent year on year from £180.70 million in H1 FY 2019 to £181.3 million in H1 FY 2020. The company reported a significant decline of 83 per cent year on year in Profit before tax from continuing operations from £15.5 million in H1 FY 2019 to £2.6 million in H1 FY 2020. This was primarily driven by the Additional PPI claims worth around £7.9 million made in the month of September 2019, which was ahead of the expectations of the management of the company.
STU share Price Performance
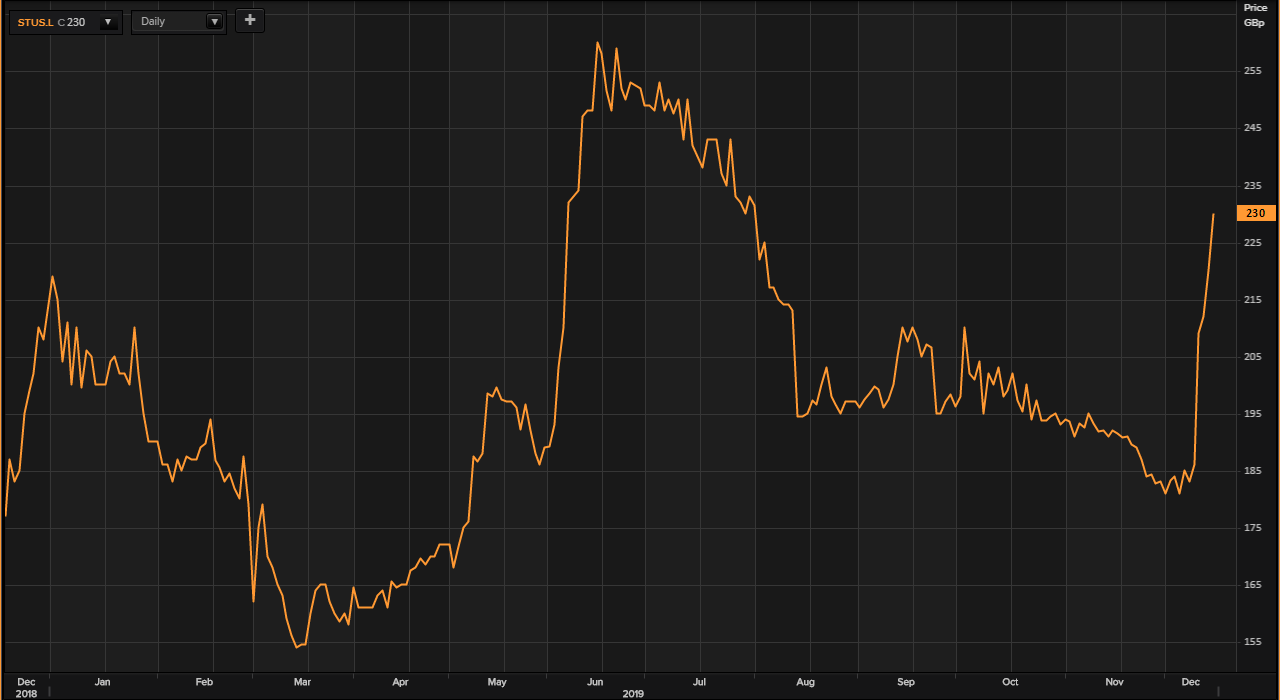
(Source: Thomson Reuters) Daily Chart as on 16-December-19, before the close of the market
As on 16th December 2019, at 11:00 A.M GMT, at the time of writing, Studio Retail Group Plcâs price of the share was reported to have been trading at GBX 230.00 per share on the London share Exchange, an increase in the value of 4.55 per cent or GBX 10.00 per share, as opposed to the last dayâs closing share price, which was reported to have been at GBX 220.00 per share. The market capitalisation of the company was reported to have been at GBP 190.17 million in reference with the current share price of the company.
The Studio Retail Group Plc share has depicted a negative change in the last six months in the value, of around 11.54 per cent from the price of the share of GBX 260.00 per share that the companyâs share achieved on June 17, 2019.
The companyâs stockâs beta was reported to be at a value of 0.4656. With this, it can be implied that share price movement of Studio Retail Group Plc, is less volatile, as opposed to the movement of the comparative market index.
PetroTal Corporation
PetroTal Corporation (LON: PTAL), previously also known as Sterling Resources Limited, is a Calgary, Canada based Oil and Gas production organisation that is basically involved in the business of operating two oil and gas assets. The companyâs flagship asset is the Bretaña (Block 95) asset in Peru, in which the company holds a 100 per cent working interest. The production date for this was 1st June 2018 and holds a capacity of 39.8 Million Barrels of Oil (MMBO) 2P reserves and 79.3 Million Barrels of Oil 3P reserves. The current annual production stands at around 2,000 barrels of oil produced (BOPD) with production estimation of more than 10,000 BOPD by the year 2020. The second asset of the company is Block 107/133, in which also, the company holds a 100 per cent working interest and which has a capacity of 534 Million Barrels of Oil Equivalent (MMBOE) located in the Ucayali basin of Peru.
PTAL Production Update
 On 16th December 2019, the company published a press release to report the production update in reference to its Bretaña oil field in Block 95 in Peru. The company reported a production of 8250 barrels of oil per day at an Initial three day production rate at the BN 95-5H horizontal well. The company also made an update regarding the 5H well which was reported to have completed on time and at a 20 per cent lesser budget. This was completed using new technology that will boost oil production. The company also reported fourth quarter average production of at least 7,500 Barrels of Oil per day and 2019 exit rate between 11,000 BOPD to 13,000 BOPD has been maintained by the company.
PTAL share Price Performance
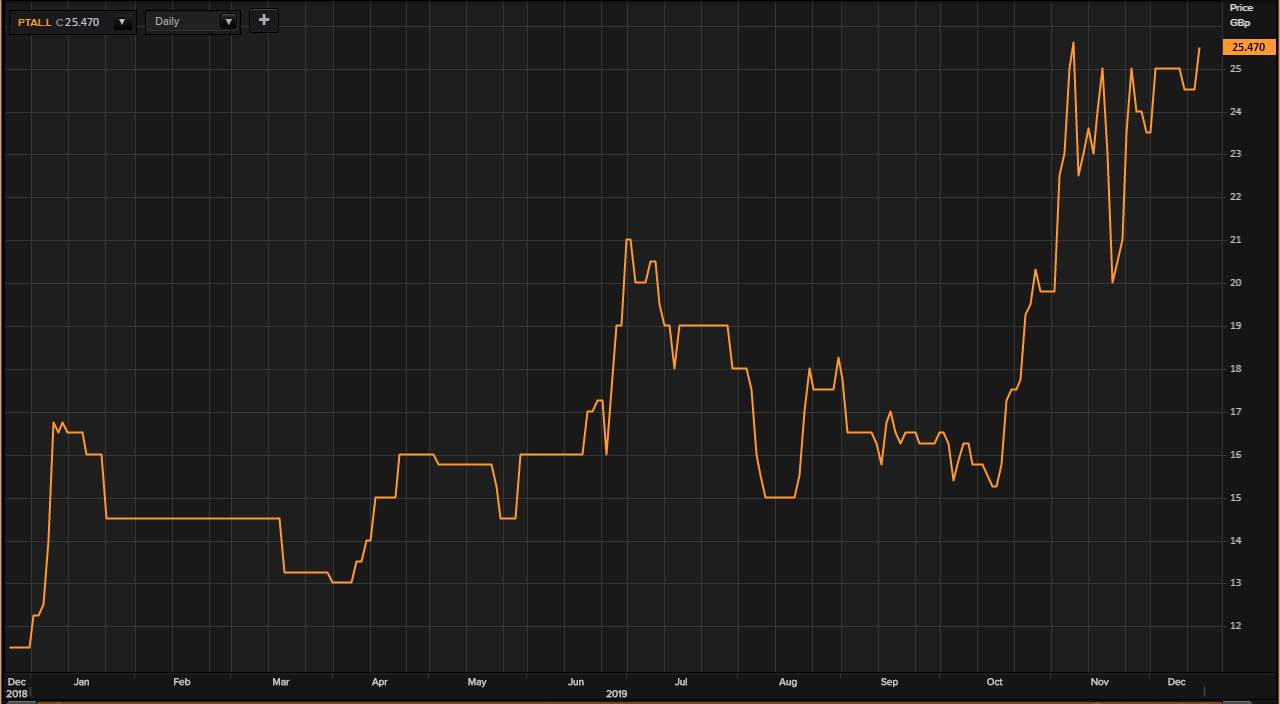
(Source: Thomson Reuters) Daily Chart as on 16-December-19, before the close of the market
As on 16th December 2019, at 11:05 A.M GMT, at the time of writing, PetroTal Corporationâs price of the share was reported to have been trading at GBX 25.47 per share on the London share Exchange, an increase in the value of 3.96 per cent or GBX 0.97 per share, as opposed to the last dayâs closing share price, which was reported to have been at GBX 24.50 per share. The market capitalisation of the company was reported to have been at GBP 164.69 million in reference with the current share price of the company.
The PetroTal Corporation share has depicted a positive change in the last six months in the value, of around 59.19 per cent from the price of the share of GBX 16.00 per share that the companyâs share achieved on June 17, 2019.
The companyâs stock beta was reported to be at a value of 1.8078. With this, it can be implied that share price movement of PetroTal Corporation, is more volatile, as opposed to the movement of the comparative market index.
Chemring Group Plc
Chemring Group Plc (LON: CHG) is a Ramsey, United Kingdom based Aerospace and Defence solutions providing company. The companyâs products and solutions span spaces such as Sensors and Information as well as Countermeasures and energetics. In terms of sensors and information, the companyâs services include the likes of Electronic Warfare, Chemical and Biological Detection, Explosive Ordnance Disposal, Innovation, technology as well as Data Science. In terms of Countermeasures and Energetics, the company provides a wide variety of services such as Advanced and Conventional Flares, Chaff, Special Material Decoys, Naval and Aircraft Countermeasures, Missile and electronics, Breaching and demolition Pyro mechanisms and Pyrotechnics.
CHG Financial Performance
On 16th December 2019, the company produced its results for the year ended 31st October 2019. The company announced a revenue growth of 13 per cent year on year from £297.4 million in FY 2018 to £335.2 million in FY 2019 primarily driven by a robust performance from the Sensors and Information business division of the company. The Underlying EBITDA was also reported at a growth of 22 per cent year on year from £50.0 million in FY 2018 to £61.2 million in FY 2019. Underlying operating profit also displayed an excellent growth of 42 per cent year on year from £31.0 million in FY 2018 to £44.0 million in FY 2019. Underlying Earnings per share also increase massively by 62 per cent from GBX 6.9 per share in FY 2018 to GBX 11.2 per share in FY 2019. In view of this excellent performance during the period, the board of the company proposed dividend at a growth of 9 per cent year on year to GBX 3.6 per share.
CHG share Price Performance
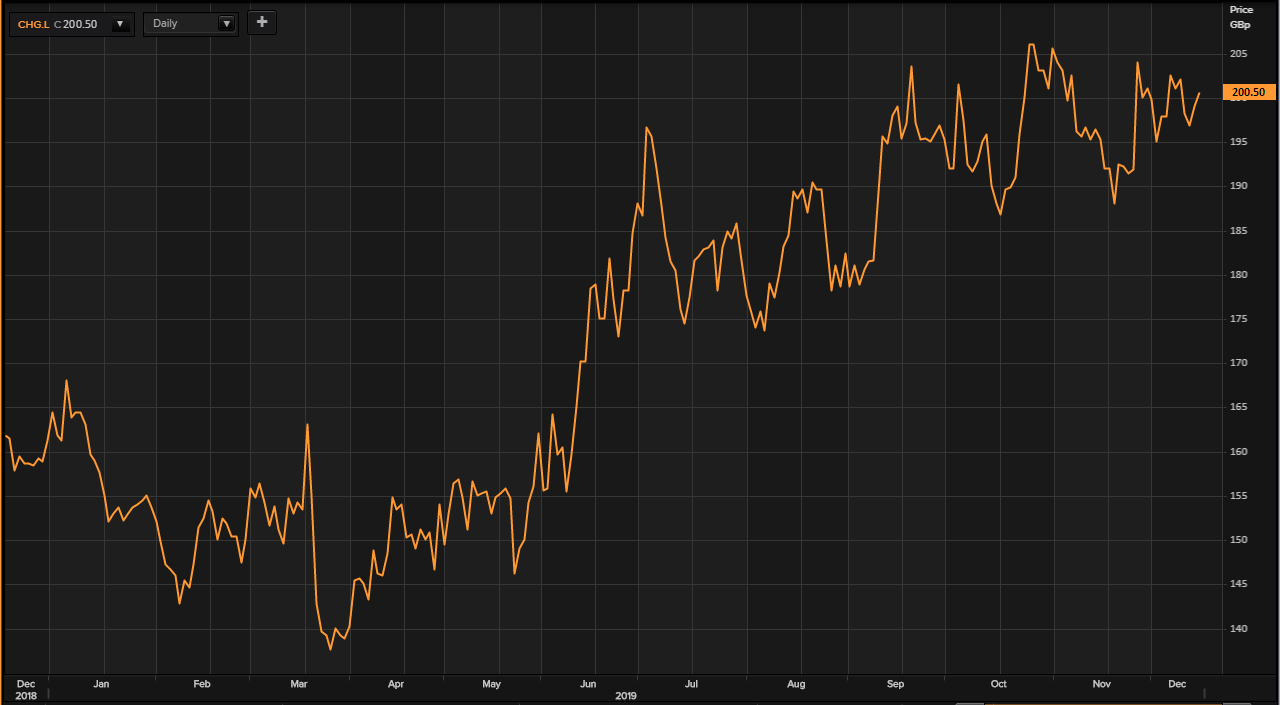
(Source: Thomson Reuters) Daily Chart as on 16-December-19, before the close of the market
As on 16th December 2019, at 11:10 A.M GMT, at the time of writing, Chemring Group Plcâs price of the share was reported to have been trading at GBX 200.50 per share on the London share Exchange, an increase in the value of 0.75 per cent or GBX 1.50 per share, as opposed to the last dayâs closing share price, which was reported to have been at GBX 199.00 per share. The market capitalisation of the company was reported to have been at GBP 558.63 million in reference with the current share price of the company.
The Chemring Group Plc share has given a depicted change in the last six months in the value, of around 12.14 per cent from the price of the share of GBX 178.80 per share that the companyâs share achieved on June 17, 2019.
The companyâs stocks beta was reported to be at a value of 0.4417. With this, it can be implied that share price movement of Chemring Group Plc, is less volatile, as opposed to the movement of the comparative market index.
