


Compass Group Plc
Compass Group Plc (CPG) is a Chertsey, the United Kingdom based company that is engaged in the business of providing consumer services such as Food vending and catering services. Food services and providing a wide variety of innovative dining solutions are the core business of the group. The company operates in around 55,000 client locations across the world. It has approximately 600,000 workforce present at these locations who work as the companyâs partners across a large number of auxiliary processes. The company serves approximately 5.5 billion meals annually. The spectrum of the companyâs services includes Food Services, within which, it provides services like vendor and catering management with a customised menu with a focus on the customerâs demands and expectations. Additionally, the second type of services that the company provides include support services such as leaning in hospitals, reception services at corporate headquarters, managing remote camps, grounds and facilities services at schools and universities and a large number of other services with a wide scope. The companyâs operations are spread across 45 countries around the world, some of which include the likes of United Kingdom, Republic of Ireland, Countries in Western Europe such as Spain, Portugal, France, Germany and Italy as well as some countries in Central and Eastern Europe as well as parts of Russia, India, China, South Africa, Brazil, Argentina, Mexico, Canada and the United States of America. The companyâs biggest segment is the Business and Industrial sector making up for 39 per cent of the groupâs total customers with brands like Eurest, Bon Appetit and Flik. The next is the Healthcare and Senior citizens sector at 24 per cent with brands like Medirest, Morrison Healthcare and Crothall Healthcare. Followed by the Education sector, which makes up for around 18 per cent of the groupâs total market, providing nutritious dining solutions to support the young students. The company also caters to Sports and Leisure as well as Defence, Offshore and Remote sectors.
CPG Financial Performance
On 26th November 2019, the company made a press release to announce its full-year results for the year ended 30th September 2019. The company highlighted that reported underlying revenue growth of 5.7 per cent year on year was primarily driven by the companyâs excellent revenue performance in the region of North America with the Organic revenue growth in the region standing at 7.7 per cent year on year. The company also reported strong financial performances from regions like India as well as Turkey. The company highlighted that the free cash flow grew by 9.3 per cent to £1.2 billion during the period, which resulted in the net debt to EBITDA ratio being valued at 1.3 times. The company reported that the Underlying Earnings per share (EPS) increased by around 6 per cent year on year from GBX 80.4 per share in FY 2018 to GBX 85.2 per share in FY 2019. This led the management to propose an increase in annual dividend by around 6.1 per cent year on year from GBX 37.7 per share in FY 2018 to GBX 40.0 per share in FY 2019.
| Change | |||
| Financial summary | 2019 | 20181 | |
| £ m |  £ m | ||
| Â | Â | ||
| Revenue | |||
| Underlying at constant currency | 25,152 | 23,795 | 5.70 % |
| Underlying at reported rates | 25,152 | 23,147 | 8.70 % |
| Statutory | 24,878 | 22,872 | 8.80 % |
| Organic growth | 6.40 % | 5.50 % | |
| Total operating profit | |||
| Underlying at constant currency | 1,882 | 1,798 | 4.70 % |
| Underlying at reported rates | 1,882 | 1,744 | 7.90 % |
| Statutory | 1,601 | 1,693 | -5.40 % |
| Operating margin | Â | ||
| Underlying at reported rates | 7.40 % | 7.40 % | - |
| Profit before tax | Â | ||
| Underlying at constant currency | 1,772 | 1,681 | 5.40 % |
| Underlying at reported rates | 1,772 | 1,630 | 8.70 % |
| Statutory | 1,469 | 1,523 | -3.50 % |
| Basic earnings per share | Â | ||
| Underlying at constant currency | 85.2 p | 80.4 p | 6.00 % |
| Underlying at reported rates | 85.2 p | 77.9 p | 9.40 % |
| Statutory | 70.0 p | 71.3 p | -1.80 % |
| Free cash flow | Â | ||
| Underlying at reported rates | 1,247 | 1,141 | 9.30 % |
| Full year dividend per ordinary share | 40.0 p | 37.7 p | 6.10 % |
Source: Company Website
CPG Stock Price Performance
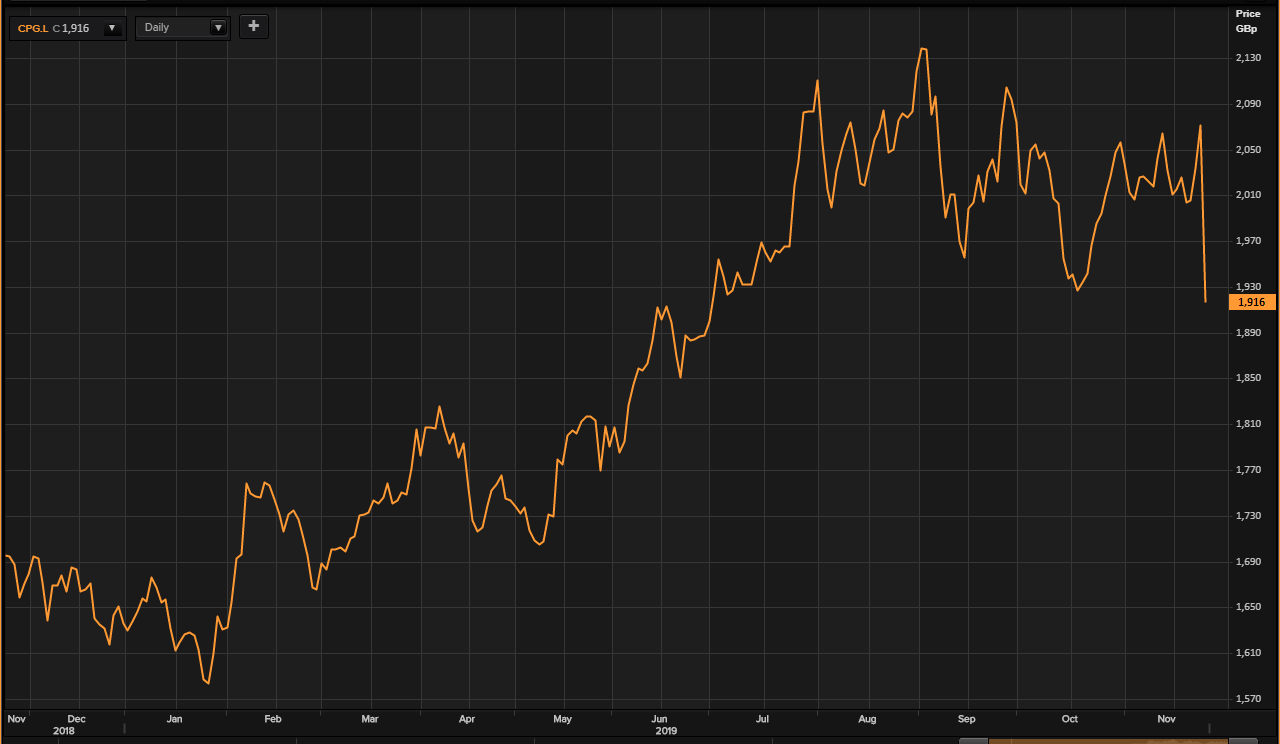
(Source: Thomson Reuters) Daily Chart as at 26-November-19, after to the market close
On 26th November 2019, at 17:30 P.M GMT, by the time of writing, Compass Group Plc âs stock price was at GBX 1916.00 per stock, a decrease of 7.48 per cent or GBX 155.00 per stock, as compared to the previous dayâs closing price, which was reported to be at GBX 2071.00 per stock. At the time of reporting, the Compass Group Plc stock was 21.61 per cent above the 52-week low stock price, which was at GBX 1575.50 per stock, that the companyâs stocks reached on January 28, 2019. At the present price, the stock was also trading 10.88 per cent below the 52-week high price at GBX 2150.00 per stock, which the companyâs stock achieved on September 04, 2019. Compass Group Plcâs Market capitalisation (M-Cap) has been reported to be at GBP 32.854 billion.
The beta of the Compass Group Plcâs stock was reported to be at 0.81. This implies that the stock price movement of the company is less volatile, in comparison to the benchmark market indexâs movement.
Intertek Group Plc
Intertek Group Plc (LON:ITRK) is a London, the United Kingdom based organisation that is involved in the business of providing âTotal Quality Assurance Servicesâ to products, processes and systems. The group is a leading global quality assurance provider in 1,000 locations in around 100 countries. The group provides quality assurance services round the clock, seven days a week with the industry-leading process and customer-centric approach. The company has four major services which are Assurance, Testing, Inspection and Certification, which the company provides to industries such as Chemicals. Food and Healthcare, Construction and Engineering, Government and Trade, Energy and Commodities, Products and Retail, Transportation as well as other support service companies like Auditing, Consulting, Sourcing and Training.
ITRK Trading Statement
On 26th November 2019, the company announced a trading update for the ten months period from 1st January 2019 to 31st October 2019. The company reported the group revenue of around £2.487 billion in the reporting period, a year on year increase of 7.4 per cent on actual rates. The company also reported that it had made some progress in terms of revenue from acquisitions which was reportedly up by 1.4 per cent year on year. In terms of the outlook, the company highlighted that the board is anticipating delivering a strong organic revenue growth. The company also anticipates for its trade division to have an advantage because of the growth in the global trade-flow, as well as an increased focus on quality and supply chain risk management.
| 10 months - January to October | 4 months - July to October | |||||||
| 2019 | 2018 | Change at actual | Change at constant | 2019 | 2018 | Change at | Change at constant | |
| £ m | £ m | £ m | £ m | actual | ||||
| Group | ||||||||
| Revenue | 2,487.50 | 2,315.70 | 7.40 % | 4.70 % | 1,044.90 | 968.0 | 7.90 % | 4.50 % |
| Organic revenue | 2,438.00 | 2,301.50 | 5.90 % | 3.30 % | 1,023.00 | 955.5 | 7.10 % | Â 3.60 % |
| Products | ||||||||
| Revenue | 1,499.70 | 1,392.50 | 7.70 % | 4.50 % | 632.9 | 586.9 | 7.80 % | 3.90 % |
| Organic revenue | 1,457.00 | 1,382.50 | 5.40 % | 2.30 % | 613.9 | 577.1 | 6.40 % | 2.60 % |
| Trade | ||||||||
| Revenue | 565.9 | 529.0 | 7.00 % | 4.90 % | 233.2 | 218.5 | 6.70 % | 3.60 % |
| Organic revenue | 559.1 | 524.8 | 6.50 % | 4.40 % | 230.3 | 215.8 | 6.70 % | 3.50 % |
| Resources | ||||||||
| Revenue | 421.9 | 394.2 | 7.00 % | 5.20 % | 178.8 | 162.6 | 10.00 % | 7.60 % |
| Organic revenue | 421.9 | 394.2 | 7.00 % | 5.20 % | 178.8 | 162.6 | 10.00 % | 7.60 % |
Source: Company Website
ITRK Stock Price Performance
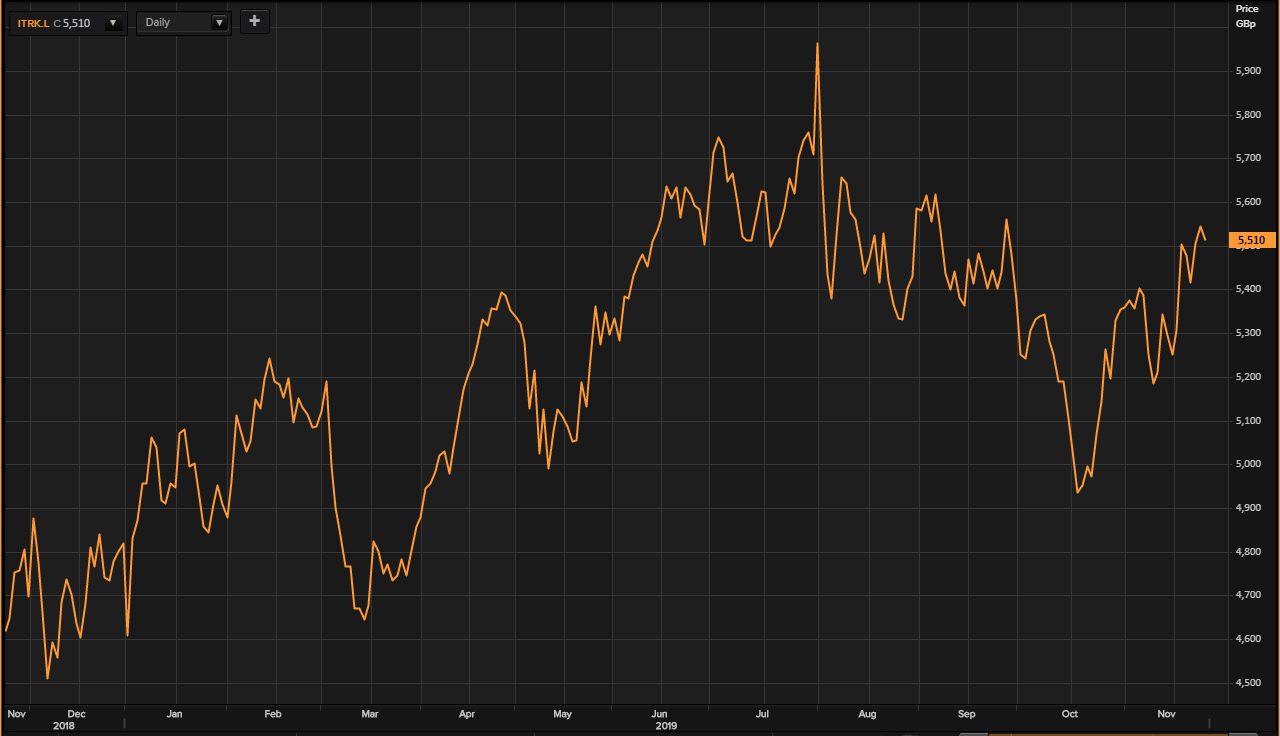
(Source: Thomson Reuters) Daily Chart as at 26-November-19, after to the market close
On 26th November 2019, at 17:38 P.M. GMT, at the time of writing, Intertek Group Plc âs stock price has been reported to be trading at GBX 5510.00 per stock, a decrease of 0.61 per cent or GBX 34.00 per stock, as compared to the previous dayâs closing price, which was reported to be at GBX 5544.00 per stock. At the time of reporting, the Intertek Group Plc stock was reported to be 22.85 per cent above the 52-week low stock price, which was at GBX 4485.00 per stock, that the companyâs stocks reached on December 06, 2018. At the present price, the stock was also trading 7.89 per cent below the 52-week high price at GBX 5982.00 per stock, which the companyâs stock achieved on August 01, 2019. Intertek Group Plcâs Market capitalisation (M-Cap) has been reported to be at GBP 8.947 billion.
The beta of the Intertek Group Plcâs stock was reported to be at 0.96. This implies that the stock price movement of the company is less volatile, in comparison to the benchmark market indexâs movement.
