


ITV PLC
ITV PLC (ITV) is a London, United Kingdom-headquartered integrated producer broadcaster (IPB). The group creates, owns and distributes high-quality content on multiple platforms globally, and owns 13 of the regional licenses and sells advertising on behalf of all licences, making it the largest family of commercial channels in the UK. The company's operations are differentiated in two segments: Broadcast & Online and ITV Studios.
Trading Update for Q1 FY19
The group reported that total external revenue fell by 4% in the first quarter to £743 million, while like-for-like revenue dropped by 4% to £874 million. Total advertising revenue also decreased by 7% to £417 million, while non-advertising revenue was down by 1% to £457 million. The group informed that demand for advertising is getting impacted by the continued economic and political uncertainty, because of which the company expects total advertising to be down 6% over the first half.
Financial Highlights-FY18
Total ITVâs revenue was up by 3% to £3,766 million, against £3,655 million in 2017, with a rise of 3% reported in external revenue at £3,211 million. Adjusted EBITA, driven by the closure of Encore and investment in the schedule for the World Cup, decreased by 4% to £810 million in 2018. The EBITA margin also declined by two percentage points to 25% as compared to the last year data. The statutory profit before tax reported a rise of 13% to £567 million. The diluted adjusted EPS dropped by 4% to 15.4 pence, though the weighted average diluted number of shares declined year-on-year. The statutory EPS grew by 15% to 11.7 pence, reflecting a decline in the reduction in exceptional items and net financing costs.
Keeping in line with the Board's target to deliver at least 8 pence per share dividend per year in 2018 and 2019, the group announced a full-year dividend of 8.0 pence, up by 3%, against the 7.8 pence announced in 2017.
Share price performance
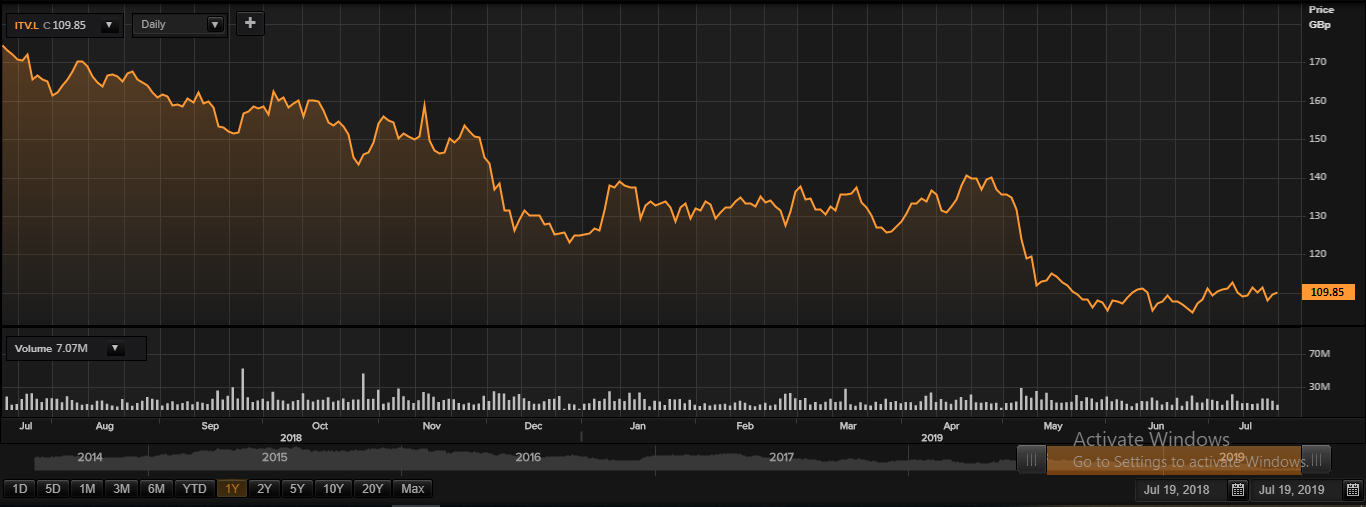
Daily Chart as at July-19-19, before the market close (Source: Thomson Reuters)
On July 19, 2019, at the time of writing (before the market close, at 12:22 PM GMT), ITV Plc shares were trading at GBX 109.85, up by 0.41 per cent against the previous day closing price. Stock's 52 weeks High and Low are GBX 175.10/GBX 102.65. At the time of writing, the share was trading 37.26 per cent lower than the 52w High and 7.01 per cent higher than the 52w low. Stockâs average traded volume for 5 days was 11,657,758.20; 30 days â 11,296,158.00 and 90 days â 12,211,192.10. The average traded volume for 5 days was up by 3.2 per cent as compared to 30 days average traded volume. The companyâs stock beta was 1.14, reflecting high volatility as compared to the benchmark index. The outstanding market capitalisation was around £4.36 billion, with a dividend yield of 7.31 per cent.
Silence Therapeutics PLC
Silence Therapeutics plc (SLN) is a United Kingdom-based company, majorly involved in the research and development of pharmaceutical products based on RNA (ribonucleic acid) technology. This technology harnesses the body's natural occurring mechanisms to create therapeutic effects within its own cells of the body.
Recent News
The company has partnered with Mallinckrodt (a global biopharmaceutical company). They will together research and develop RNAi technology-based drug targets, with the objective of inhibiting or nullifying a group of proteins which are responsible for inflammation and other disorders related to the immune system. Mallinckrodt has agreed to make an investment of $5 million in Silence Therapeutics equity shares. The shares would be issued at a price of 79 pence per share with a total of 5,062,167 new shares.
Financial highlights for FY18
The companyâs loss after tax stood at £18.4 million in FY18 as against loss after tax of £1.6 million in FY17. In FY17 the losses were lower due to £9.1 million of gains on the disposal of Arrowhead shares, which was not the case this year; and £1.3 million proceeds from the liquidation of an overseas subsidiary, which was not the case in FY18. In FY18, the company saw an exceptional rise in expenditure relating to legal proceedings (total legal fees stood at £4.0 million as against £0.8 million in FY17). The company has cash balances of £26.5 million in FY18 as against £42.7 million in FY17. The companyâs net cash outflow from operations stood at £16.8 million in FY18 as against £9.6 million in FY17.
Share price performance
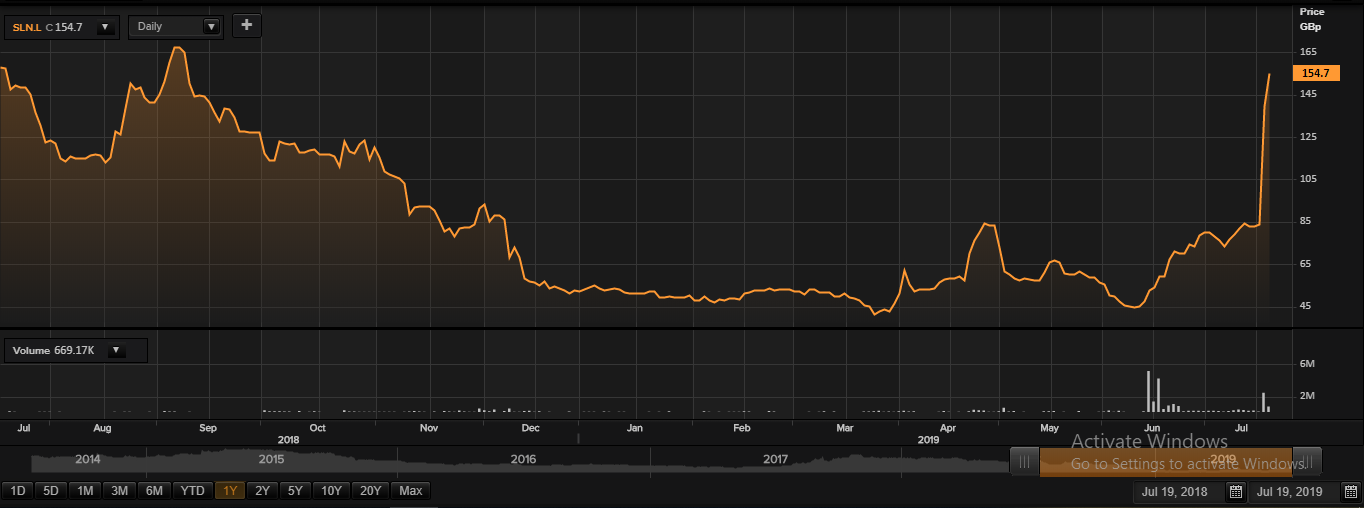
Daily Chart as at July-19-19, before the market close (Source: Thomson Reuters)
On July 19, 2019, at the time of writing (before the market close, at 11:47 AM GMT), Silence Therapeutics shares were trading at GBX 154.7, up by 11.29 per cent against the previous day closing price. Stock's 52 weeks High and Low are GBX 175.00 /GBX 40.00. At the time of writing, the share was trading 11.6 per cent lower than the 52w High and 286.75 per cent higher than the 52w low. Stockâs average traded volume for 5 days was 598,363.60; 30 days â 609,723.03 and 90 days â 244,640.93. The average traded volume for 5 days was down by 1.86 per cent as compared to 30 days average traded volume. The companyâs stock beta was 1.54, reflecting high volatility as compared to the benchmark index. The outstanding market capitalisation was around £99.47 million.
SAP SE
SAP SE (0NW4) is an ERP (Enterprise resource planning) software and service provider. The company has diversified its business model into two segments: Applications, Technology & Services segment, and the SAP Business Network segment. The first segment is responsible for the sale of software licenses and subscriptions, and the latter one is responsible for includes its cloud-based collaborative business networks and services.
Q2 FY19 results
The companyâs cloud & software revenue as well as the total revenue was up by 11 per cent in Q2 2019. The companyâs operating profit (IFRS) plunged by 21 per cent due to restructuring and surge in share prices. The companyâs operating cash flow (6 months) stood at â¬2.68 billion, which was down by 10 per cent from the same period previous year, while the companyâs free cash flow stood at â¬1.96 billion.
Financial Highlights for H1 FY19
The companyâs total revenue stood at â¬12,722 million in H1 FY19 as against â¬11,260 million in H1 FY18. The companyâs operating expenses (up by 31 per cent) stood at â¬12,031 million in H1 FY19 as against â¬9,192 million in H1 FY18. The companyâs operating profit (down by 67 per cent) stood at â¬691 million in H1 FY19 as against â¬2,069 million in H1 FY18. The companyâs basic EPS stood at â¬0.38 (down by 68 per cent) in H1 FY19 as against â¬1.19 in H1 FY18.
Share price performance
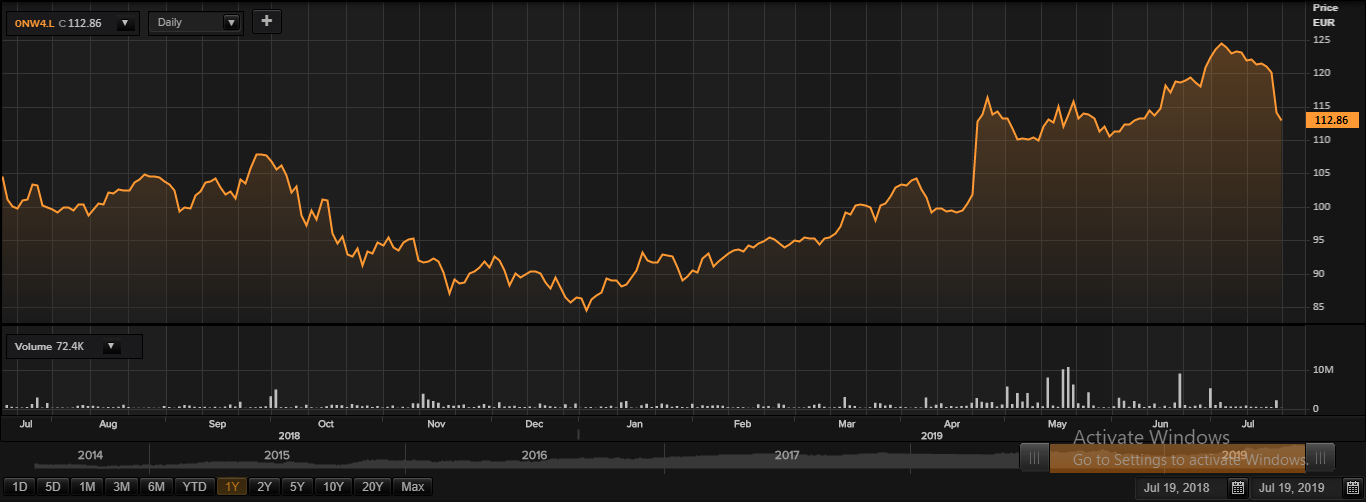
Daily Chart as at July-19-19, before the market close (Source: Thomson Reuters)
On July 19, 2019, at the time of writing (before the market close, at 11:03 AM GMT), SAP SE shares were trading at EUR 112.86, down by 1.06 per cent against the previous day closing price. Stock's 52 weeks High and Low are EUR 124.98/EUR 84.04. At the time of writing, the share was trading 9.69 per cent lower than the 52w High and 34.29 per cent higher than the 52w low. The companyâs stock beta was 0.98, which means it is as volatile as the benchmark index. The outstanding market capitalisation was around â¬134.64 billion.
Fevertree Drinks PLC
Fevertree Drinks plc (FEVR) is a United Kingdom-based beverage company. It manufactures aerated drinks, including water-based products. These products are available in restaurants, hotels, bars, cafes and supermarkets.
 Financial Highlights for FY18
The companyâs revenue stood at £237.4 million (surged by 40 per cent) in FY18 as against £170.2 million in FY17. The companyâs gross profit margin stood at 51.8 per cent in FY18 as against 53.5 per cent in FY17. The companyâs adjusted EBITDA stood at £78.6 million in FY18 as against £58.7 million in FY17. The companyâs profit after tax stood at £61.8 million this year as against £45.5 million in FY17. The companyâs diluted EPS stood at 53.19 pence in FY18 as against 39.15 pence in FY17. The companyâs net cash stood at £83.6 million in FY18 as against £50.9 million in FY17. The company declared an annual dividend of 14.50 pence per share in FY18 as against 10.65 pence per share in FY17.
Share price performance
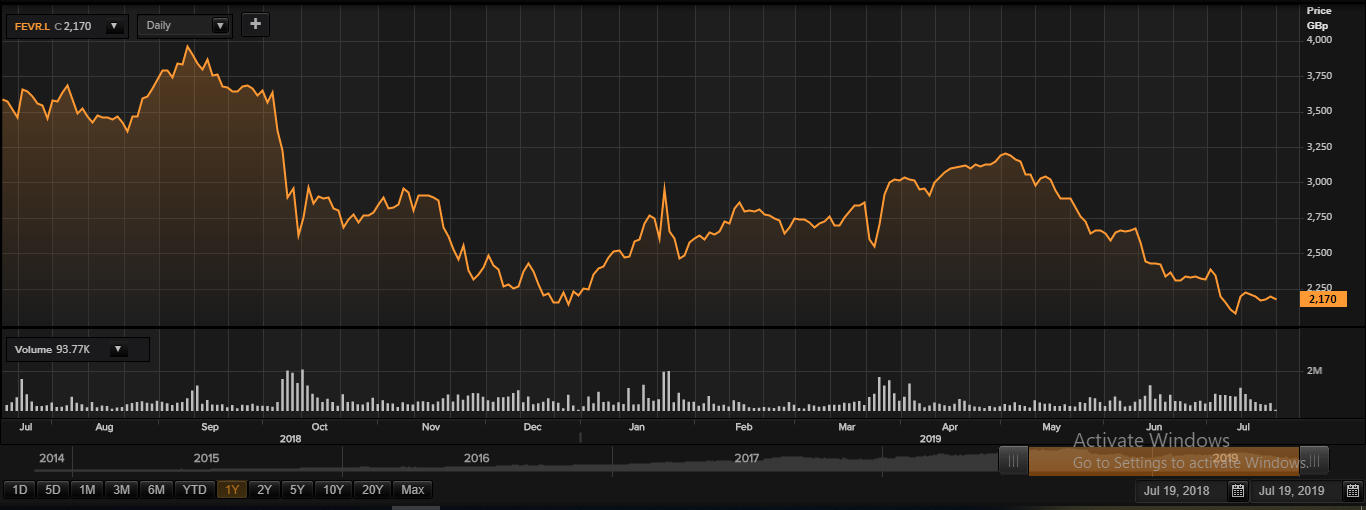
Daily Chart as at July-19-19, before the market close (Source: Thomson Reuters)
On July 19, 2019, at the time of writing (before the market close, at 12:45 PM GMT), Fevertree shares were trading at GBX 2,170, down by 0.91 per cent against the previous day closing price. Stock's 52 weeks High and Low are GBX 4,120.00 /GBX 2,021.00. At the time of writing, the share was trading 47.33 per cent lower than the 52w High and 7.37 per cent higher than the 52w low. Stockâs average traded volume for 5 days was 432,742.60; 30 days â 596,816.70 and 90 days â 515,590.40. The average traded volume for 5 days was down by 27.49 per cent as compared to 30 days average traded volume. The companyâs stock beta was 1.68, reflecting high volatility as compared to the benchmark index. The outstanding market capitalisation was around £2.52 billion, with a dividend yield of 0.66 per cent.
Apple Inc
Apple Inc (0R2V) is into designing and manufacturing of mobile and media devices, computers and other infotainment products. Along with these products, the company provides software and application services, network solutions and digital content as well. The company has a popular image worldwide and is known for its flagship products such as iPhone, iPad, Mac, iPod, Apple Watch, Apple TV and many more. The popular applications are iCloud, Apple CarPlay a range of support offerings.
Financial Highlights for Q2 FY19
The companyâs total net sales stood at $58,015 million in Q2 FY19 as against $61,137 million in Q2 FY18. The companyâs gross margin stood at $21,821 million in Q2 FY19 as against $23,422 million in Q2 FY18. The companyâs operating income stood at $13,415 million in Q2 FY19 as against $15,894 million in Q2 FY18. The companyâs basic EPS stood at $2.47 per share in Q2 FY19 as against $2.75 per share in Q2 FY18.
Share price performance
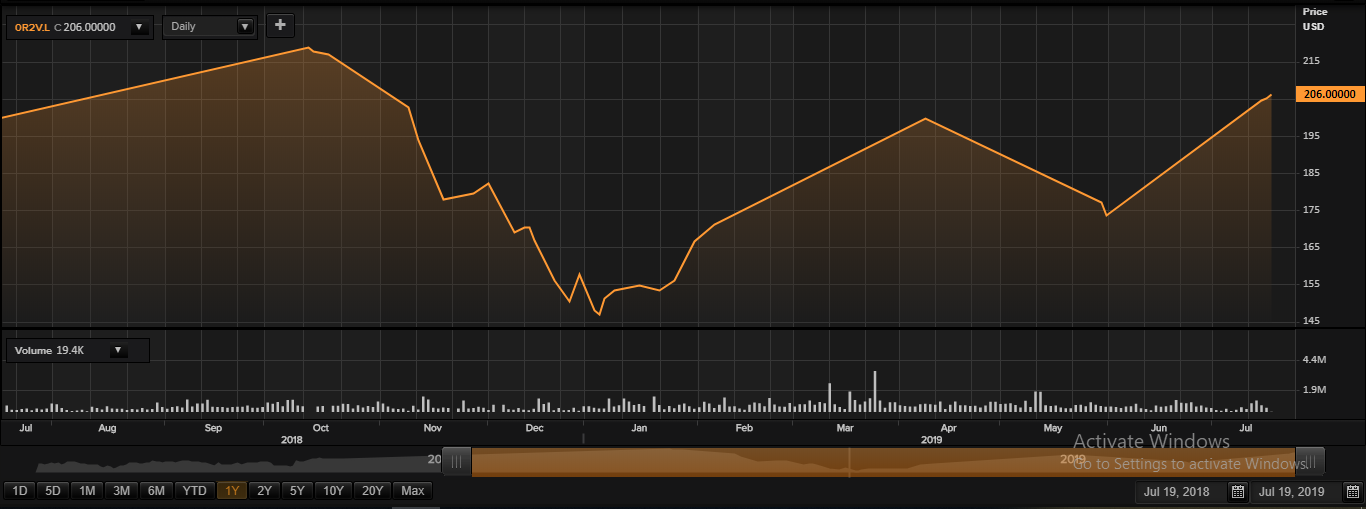
Daily Chart as at July-19-19 (Source: Thomson Reuters)
On July 19, 2019, at the time of writing (at 10:55 AM GMT), Apple Inc shares were at USD 206. Apple Incâs 52 weeks High and Low are USD 233.40/USD 142.09. At the time of writing, the share was trading 11.73 per cent lower than the 52w High and 44.97 per cent higher than the 52w low. Stockâs average traded volume for 5 days was 474,506.00 and 30 days â 573,325.27. The average traded volume for 5 days was down by 17.24 per cent as compared to 30 days average traded volume. The companyâs stock beta was 1.24, reflecting high volatility as compared to the benchmark index. The outstanding market capitalisation was around $946.26 billion, with a dividend yield of 1.45 per cent.
