


_07_03_2026_03_50_21_133108.jpg)

Source: Tricky_Shark, Shutterstock
Summary
- Just Eat Takeaway gained 6.81% percent in the last trading session.
- The price has broken crucial resistance level and jumped almost ~22.38 percent in the last six trading sessions.
- JET stock prices are trading in a falling channel formation on the daily chart.
- Stock prices are trading around the downward sloping trend line on the weekly chart and getting support from the Parabolic SAR indicator.
Source: Brookgardener, Shutterstock
Just Eat Takeaway NV (LON: JET) has surged ~22.38 percent in the last eight trading sessions. The stock price has shown a sharp rally from the low of GBX 6422 tested on 31 March 2021 to a high of GBX 7859 made on 13 April 2021. On Tuesday, the stock prices closed at GBX 7855, up by 6.81%, and remained as one of the top gainers in the FTSE-100 index. The stock outperformed some of its peers, such as Studio Retail Group PLC (LON: STU) rose by 6.4%, AO World PLC (LON: AO.) jumped by 4.3% and Ocado Group PLC (LON: OCDO) gained 2.43%.
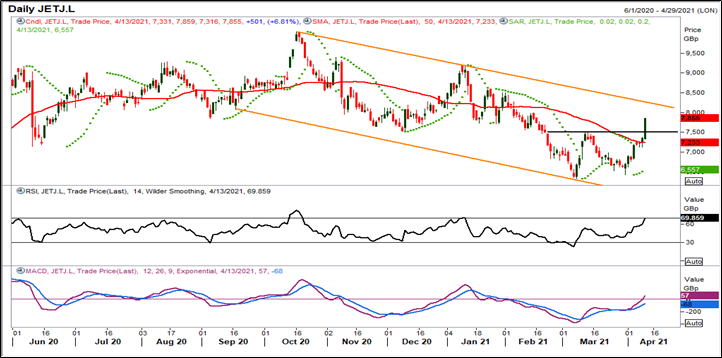
JET on a daily chart
Source: EODHD/Others, Thomson Reuters; Analysis: Kalkine Group
The stock prices have broken a double bottom (bullish reversal) pattern at GBX 7496 level on the daily chart, and after that the prices touched the 2-month high of GBX 7859. After consolidating in the range of GBX 6347- GBX 7496 for more than one month, the price registered a decisive breakout indicating a possibility of change in trend from sideways to northward direction. The stock prices have been trading in the falling channel formation for the past eight months on the daily chart.
Besides, the price is trading above its 50-period SMA, acting as a crucial support zone around the double bottom breakout level. The price is trading above its Parabolic SAR indicator, acting as a support zone for the stock. MACD is also showing a positive crossover, which suggests a positive momentum. However, the momentum oscillator RSI (14-Period) is trading near the overbought zone at ~69.85 levels, indicating that a correction from here may drift the price lower towards the support zone.
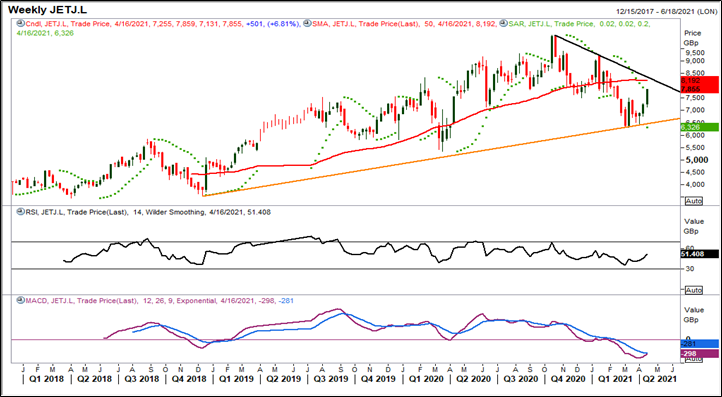
JET on a weekly chart
Source: EODHD/Others, Thomson Reuters; Analysis: Kalkine Group
The stock prices are trading above an upward sloping trendline support level of GBX 6452 (orange color line in the above chart) and continuously taking support of the same. In the past, the prices faced a strong resistance of a downward sloping trendline at GBX 8145 level on the weekly chart and currently, the price is again approaching the downward sloping trendline resistance zone.
Moreover, the momentum oscillator RSI (14-Period) is trading at ~51.40 levels, which supports bullish bias for the stock. However, the stock price is trading below its 50-period (SMA), acting as a crucial resistance zone near the falling trendline. Furthermore, the prices are trading around the major resistance level GBX 8192 and a downside movement from the current levels might drift prices lower towards the rising trendline. The price is trading above its Parabolic SAR indicator and appears positive for the uptrend.
Just Eat Takeaway NV price seems to be in an uptrend, as depicted by the above chart analysis and technical outlook. Currently, the share prices are holding the key support zone. The chart pattern suggests that there might be more action expected in JET if the price remains above the support levels. If the prices break the crucial resistance level in the coming weeks, the bulls may extend the rally.
