


Boohoo Group PLC
Boohoo Group Plc (BOO), the AIM listed company is among the top online fashion retail company in the UK. It has a global footprint, including the UK, Europe, Australia and the US being the primary markets. The companyâs products are targeted at the age group of 16-30 years with its brands such as Boohoo, PrettyLittleThings, NastyGal and boohooMAN.
BOO-Financial highlights for H1 FY20
On 25th September 2019, the company released its interim results for the period ended 31st August 2019. Led by strong sales growth across the groupâs brand and geographies, Boohoo Group Plc recorded stellar top-line growth of 43%. The groupâs revenue surged to £564.9m in the H1 FY20 from £395.3m reported in the year-ago period. Adjusted EBITDA margin during the period stood at 10.8% against 10.0% reported in the year-ago period and adjusted diluted earnings per share surged by 46.2% to 2.91p from 1.99p recorded in the year-ago period and diluted earnings per share surged by 79.1% to 2.48p.
During the period under consideration, the group's revenue in the UK recorded a growth of 35% and International sales were up by 55%, International revenue stands for 44% of the group's total revenue as compared to 41% contribution it reported in the year-ago period.
Boohoo Plc reported stellar growth across the product portfolio and geographies where the group operates. Also, Group's dependency on the UK is diluting as International sales reached to 44% of the total group's revenue, which will help the group to hedge itself against the tumbling Sterling as well. However, UK still is the biggest contributor in the group's total revenue.
The group provided full-year guidance for the FY20, in which it stated that FY20 revenue is estimated to grow between 33% to 38% on a YoY basis, with an adjusted EBITDA margin of the year to remain approximately 10%.
BOO-Share price performance
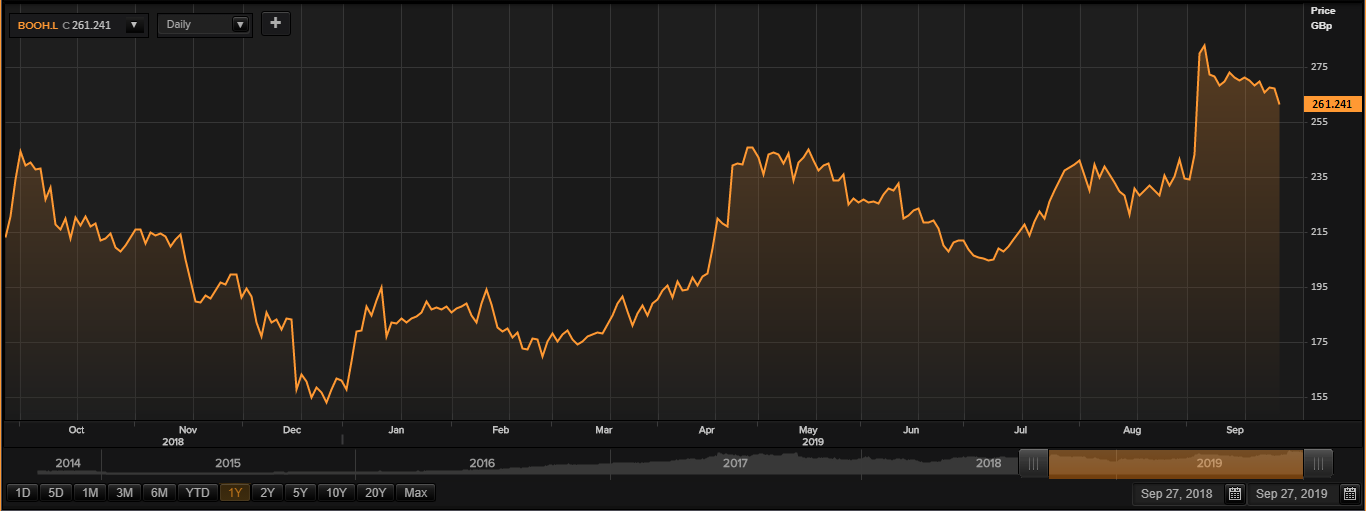
Daily Chart as on 27-September-19, before the market close (Source: Thomson Reuters)
On 27 September 2019, at the time of writing (before the market close, at 11.40 am GMT), Boohoo Group Plc shares were trading at GBX 261.24. Stock's 52 weeks High and Low are GBX 288.60/GBX 146.39. Stockâs average traded volume for 5 days was 4,596,928.40; 30 days â 3,787,739.97 and 90 days â 3,865,792.11. The companyâs stock beta was 1.45, reflecting higher volatility of the stock as compared with the benchmark index. The outstanding market capitalisation was around £3.11 billion.
Â
Octagonal plc
Octagonal Plc (OCT) is a financial services company. Global Investment Strategy UK Limited (GIS), a subsidiary of the company provides settlement services globally and custodian services to investors, hedge funds, HNIâs along with ancillary services. In addition, the company also provides banking, advisory and broking services to retail, corporate and eligible clients. GIS Investment management division manages funds for both domestic and international clients.
OCT-Financial highlights for FY19
On 25th September 2019, the company declared its annual results for the financial year 2019 period ended 31st March 2019. The companyâs revenue plunged by 18.32 per cent to £5.3 million in FY19 as against £6.5 million in FY18. The companyâs profit before taxation stood at £926,000 in FY19 as against £1,517,000 in FY18. The companyâs core operating margin surged to 15.67 per cent in FY19 as against 11.97 per cent in FY18. The companyâs core pre-tax profits surged by 33.3 per cent to £0.796 million in FY19 as against £0.597 million in FY18. The company had cash balances of £5.5 million in FY19 as against £5.3 million in FY18. The company declared a dividend of 0.1 pence per share in FY19.
OCT-Share price performance
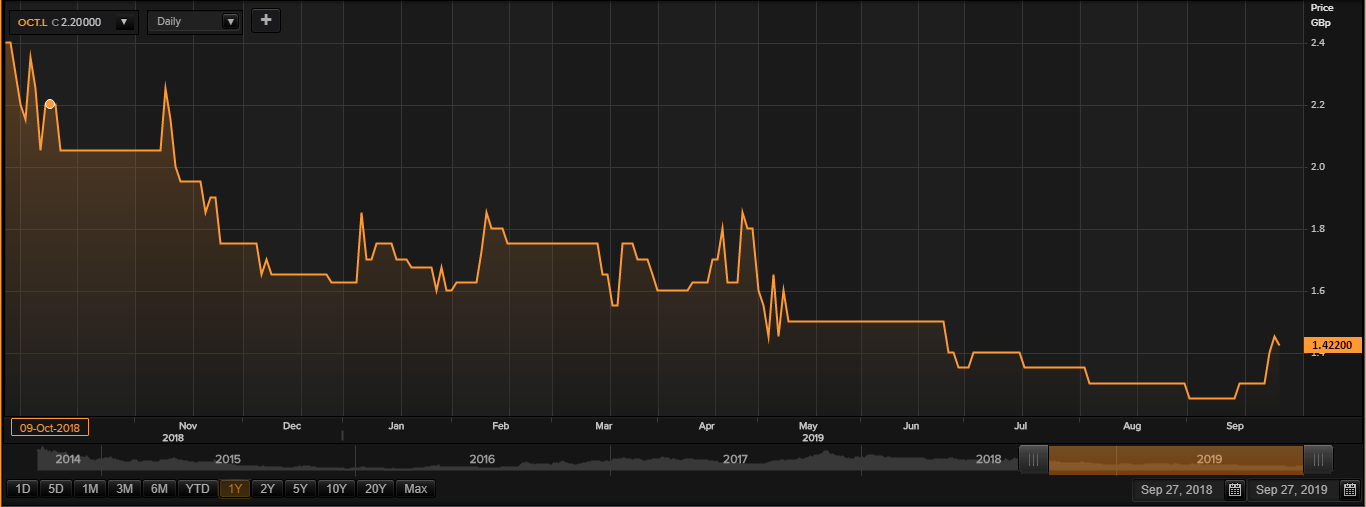
Daily Chart as on 27-September-19, before the market close (Source: Thomson Reuters)
On 27 September 2019, at the time of writing (before the market close, at 11.45 am GMT), Octagonal Plc shares were trading at GBX 1.42. Stock's 52 weeks High and Low are GBX 2.50/GBX 1.10. Stockâs average traded volume for 5 days was 766,469.40; 30 days â 410,462.40 and 90 days â 415,129.22. The companyâs stock beta was 0.95, reflecting less volatility of the stock as compared with the benchmark index. The outstanding market capitalisation was around £8.26 million.
London Finance & Investment Group PLC
United Kingdom based London Finance & Investment Group Plc (LFI) is a finance and investment management company. The company aims to create value for shareholders by generating growth with a long-term horizon coupled with a progressive dividend policy. The company invests in equity, debt and short-term (liquid) investments, which are varied across food & beverages, natural resources, chemicals, tobacco, property and other physical assets.
LFI-Financial highlights for H1 FY19 period ended 31st December 2018
The companyâs net assets per share plunged by 5.2 per cent to 62 pence per share at 31st December 2018 from 65.4 pence per share at 30th June 2018. During the period, the strategic investments plunged by 4 per cent in value. As on 31st January 2019, after business hours the companyâs NAV per share was 59.9 pence. The companyâs loss before taxation was £721,000 during the period. The company has declared a half-yearly dividend of 0.55 pence per share during H1 FY19.
LFI-Share price performance
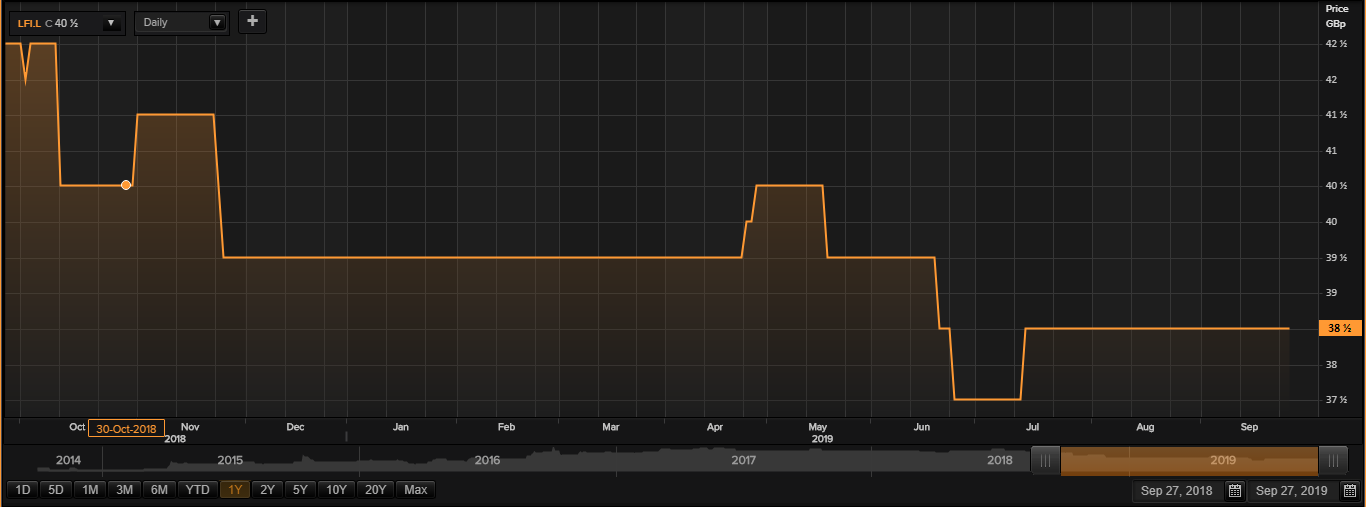
Daily Chart as on 27-September-19, before the market close (Source: Thomson Reuters)
On 27 September 2019, at the time of writing (before the market close, at 11.48 am GMT), London Finance & Investment Group Plc shares were trading at GBX 38.50. Stock's 52 weeks High and Low are GBX 42.75/GBX 37.00. Stockâs average traded volume for 5 days was 3,796.20; 30 days â 4,218.83 and 90 days â 20,748.29. The companyâs stock beta was 0.34, reflecting less volatility of the stock as compared with the benchmark index. The outstanding market capitalisation was around £12.04 million.
Â
Crimson Tide PLC
United Kingdom based Crimson Tide plc (TIDE) has subsidiaries which are into development of mobility solutions along with related software. They provide development, support services and commercialisation of these solutions. The companyâs proprietary mobility platform, mpro5 software can handle out of office tools to carry out certain tasks such as paperwork, signed authorizations, photographic evidence and geo location tagging usually with a handheld mobile device.
TIDE-Financial highlights for H1 FY19 period ended 30th June 2019
The companyâs revenue surged by 5.5 per cent to £1,267 thousand in H1 FY19 as against £1,201 thousand in H1 FY18. The companyâs profit before taxation surged by 2,000 per cent to £101 thousand in H1 FY19 as against £4 thousand in H1 FY18. The companyâs basic earnings per share stood at 0.02 pence per share in H1 FY19. The companyâs diluted earnings per share stood at 0.02 pence per share in H1 FY19. The companyâs business has grown during the period.
TIDE-Share price performance
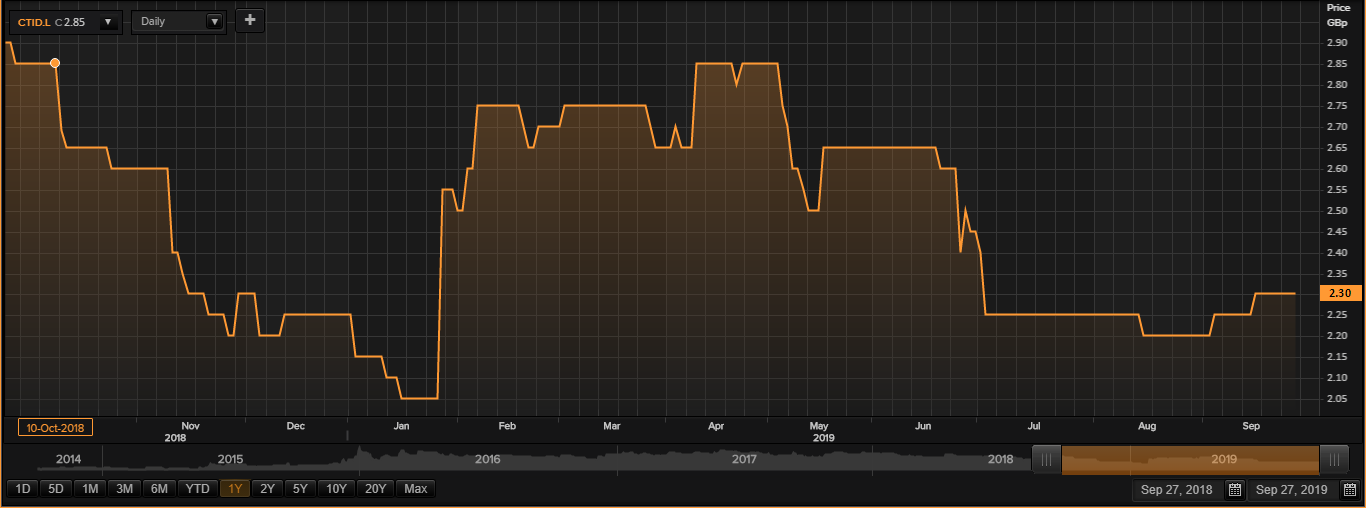
Daily Chart as on 27-September-19, before the market close (Source: Thomson Reuters)
On 27 September 2019, at the time of writing (before the market close, at 11.51 am GMT), Crimson Tide PLC shares were trading at GBX 2.30. Stock's 52 weeks High and Low are GBX 3.00/GBX 1.90. Stockâs average traded volume for 5 days was 154,655.40; 30 days â 218,052.40 and 90 days â 290,550.24. The companyâs stock beta was 0.81, reflecting less volatility of the stock as compared with the benchmark index. The outstanding market capitalisation was around £10.55 million.
Â
Marble Point Loan Financing Limited
Guernsey-based Marble Point Loan Financing Limited (MPLF) is a closed-ended investment company. The company aims to generate a higher return on equity plus dividends along with regular income and progressive net assets. The company had made investments in floating rate corporate debt instruments denominated in United States dollar.
MPLF-Financial highlights for H1 FY19 for the period ending 30th June 2019
The companyâs net asset value surged to US$176.6 million at 30th June 2019 as against US$168.0 million at 31st December 2018. The company earned an adjusted net investment income of US$11.3 million during the period and the NAV total return was recorded at 10.27 per cent during the period. The company paid couple of quarterly dividends amounting to US$0.04 per share during the period. The companyâs adjusted NII stood at US$11.3 million in H1 FY19 as against US$20.8 million in FY18. The company remains focussed on generating stable income and declared dividends consistently in order to grow its net asset value.
Â
MPLF-Share price performance
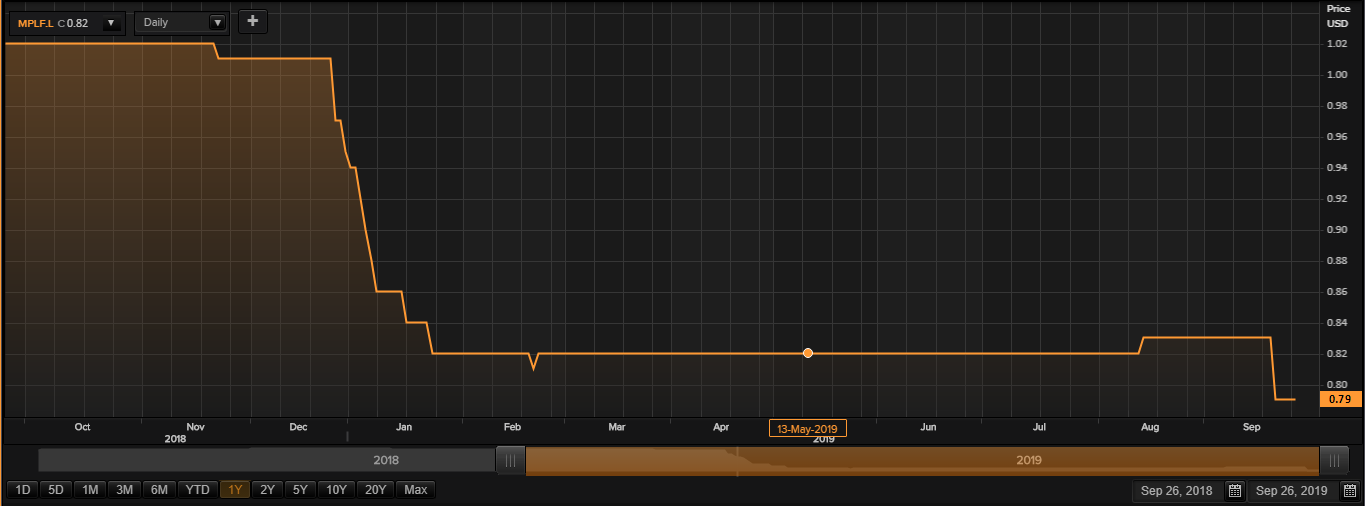
Daily Chart as on 27-September-19, before the market close (Source: Thomson Reuters)
On 27 September 2019, at the time of writing (before the market close, at 11.54 am GMT), Marble Point Loan Financing Limited shares were trading at USD 0.79. Stock's 52 weeks High and Low are USD 1.03/USD 0.79. The outstanding market capitalisation was around $162.52 million.
