


Glencore PLC
Glencore Plc (GLEN) is among the worldâs leading diversified natural resource companies, engaged in the business of production and distribution of minerals and metals, crude oil and oil products, coal and agricultural products. The company currently operates in more than 50 countries and has an employee base of around 158,000, including contractors. The company is currently managing 150 plus mines across the globe.
GLEN-Recent developments
On 25th October 2019, the company announced the Q3 FY19 production report. The companyâs copper production was recorded at 1,015,800 tonnes in Q3 FY19, which was 4 per cent lower than Q3 FY18. The companyâs cobalt production was recorded at 34,400 tonnes in Q3 FY19, which was 21 per cent higher than Q3 FY18. The companyâs zinc production was recorded at 809,200 tonnes in Q3 FY19, which was 3 per cent higher than Q3 FY18. The companyâs nickel production was recorded at 89,400 tonnes in Q3 FY19, which was 2 per cent lower than Q3 FY18. The companyâs coal production was recorded at 104 million tonnes in Q3 FY19, which was 8 per cent higher than Q3 FY18.
GLEN-Financial highlights for H1 FY19
In the first half of 2019, the companyâs reported revenue was $107,098 million as compared to $108,554 million for the same period of last year. The companyâs Adjusted EBITDA for H1 FY2019 stood at $5,582 million as compared to $8,180 million in H1 FY18. The Adjusted EBIT decreased by 56 per cent to $2,229 million for the H1 FY19 as compared to $5,091 million in H1 FY18. The companyâs Income before tax for H1 FY19 stood at $519 million as against $3,718 million for H1 FY18. The loss for the period stood at $158 million as compared to the profit of $2,574 million in H1 FY18. The companyâs basic and diluted earnings per share stood at US$ 0.02 in H1 FY19 as compared to US$ 0.19 in H1 FY18.
GLEN-Share price performance
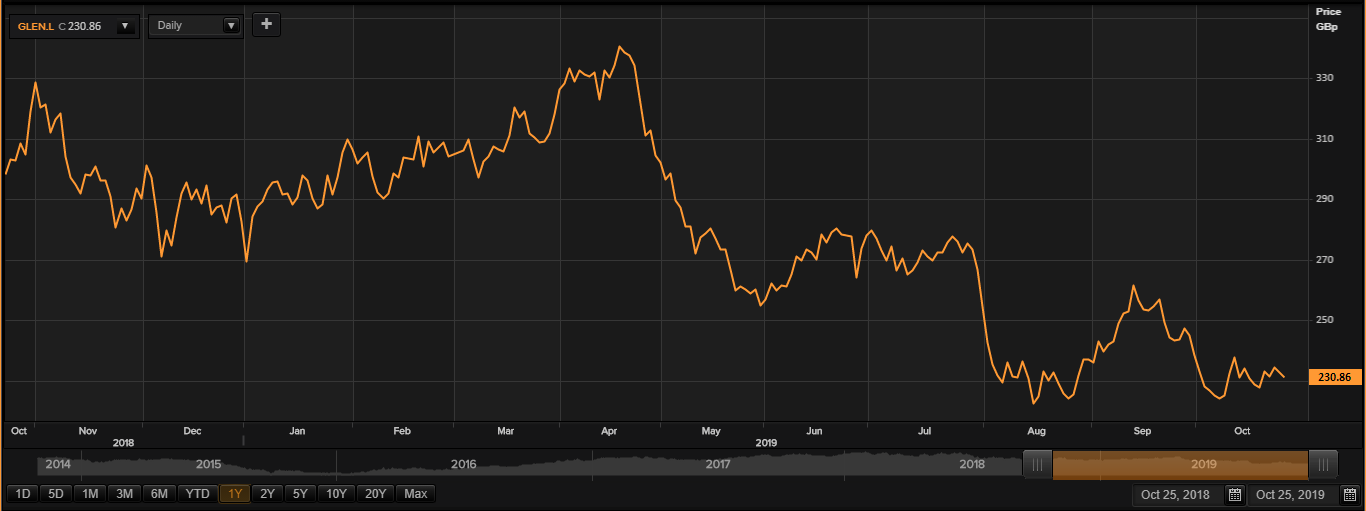
(Source: TR)
Before the market close, at the time of writing on 25th October 2019 at 09:59 AM GMT, GLEN shares were hovering around GBX 230.86 and was down by 0.64 per cent against the previous day closing price.
Glencore Plc shares have recorded a high price of GBX 343.90 and a low price of GBX 218.60 in the last year. As quoted in the price chart, at the current trading price level, shares were hovering around 5.60 per cent higher from the 52-week low price mark.
1,865 trades took place today while writing and todayâs stock traded volume was recorded at 4,041,095.
WPP PLC
WPP PLC (WPP) is a London-headquartered company, which is a world leader in communications services. It is holding company of different companies engaged in disciplines offering national and multinational clients a comprehensive range of communications services. The operations of the group are organised into four reportable segments, namely Global Integrated Agencies, Data Investment Management, Public Relations, and Specialist Agencies - which includes WPP Digital and direct, digital & interactive.
WPP-Q3 Trading update
The companyâs reported revenue was up by 5.2 per cent (AER basis) to £3,291 million in Q3 FY19. On year to date basis, the companyâs reported revenue was up by 2.8 per cent (AER basis) to £9,659 million. The company saw improvement in major markets and sectors in the third quarter of fiscal year 2019.
WPP-Financial highlights for H1 FY19
Net new business billings worth £2.934 billion were won by the group in the first half of the year, and reported billings were down by 0.5%, and down by 2.0% in constant currency, to £26.533 billion. The companyâs reported revenue surged by 1.6 per cent to £7.616 billion. Reported gross profit declined by 3.8% to £1.225 billion from £1.274 billion in the prior year, with a fall of 5.1% on a constant currency basis. Headline operating profit was £730 million, which was down by 6.8%, and down by 8.0% in constant currency, while reported operating profit declined by 20.1% to £673 million from £841.9 million in H1 2018, with a fall of 21% in constant currency. Headline operating margin declined by 0.8 bps to 11.9%, which represented a decrease of 1.2 bps points on a like-for-like basis and by 0.8 margin points in constant currency, while headline EBITDA was down by 7.7% to £875 million, down 8.9% in constant currency, which was in line with the top-line numbers. Reported profit before interest and taxation declined by 20% to £681 million from £851.3 million in H1 2018, with a fall of 20.9% on constant currency basis, while headline profit before interest and taxation was down by 8.5% to £751 million from £821 million, down 9.6% in constant currency. There was 43.5% decline in reported profit before tax to £478 million from the previous year of £846 million, and the decline was 44.1% in constant currency term, while headline profit before tax was lower by 17.6% to £605 million and was down by 18.4% in constant currency. Diluted reported earnings per share was down by 53.6% to 24.8 pence from 53.4 pence in the prior year and by 54.3% in constant currency, while diluted headline earnings per share declined by 19.7% to 34.2 pence from 42.6 pence in the previous year, with a 20.9% decline in constant currency basis.
WPP-Share price performance
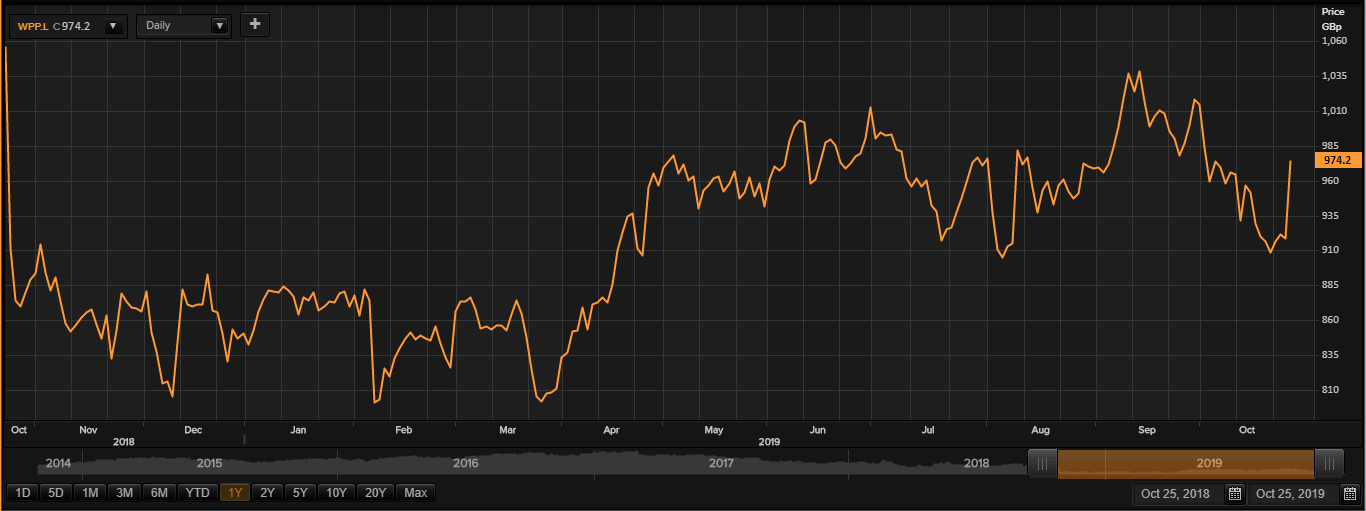
(Source: TR)
Before the market close, at the time of writing on 25th October 2019 at 10:04 AM GMT, WPP shares were hovering around GBX 974.20 and was up by 6.07 per cent against the previous day closing price.
WPP PLC shares have recorded a high price of GBX 1,047.00 and a low price of GBX 791.00 in the last year. As quoted in the price chart, at the current trading price level, shares were hovering around 23.16 per cent higher from the 52-week low price mark.
5,614 trades took place today while writing and todayâs stock traded volume was recorded at 2,114,995.
Barclays PLC
Barclays PLC (BARC) is a London, the United Kingdom-headquartered transatlantic Consumer, Corporate and Investment Bank which offers products and services across wealth management, credit cards, personal, corporate and investment banking.
BARC-Q3 Results update
The companyâs profit before taxation (excluding litigation and conduct) was recorded £3.3 billion in Q3 FY19 as against £3.1 billion in Q3 FY18. The companyâs cost to income ratio was 62 per cent in Q3 FY19, remained flat as compared in Q3 FY18. The profit before taxation for Barclays UK stood at £0.4 billion in Q3 FY19 as against £1.6 billion in Q3 FY18. The company also made an additional provision of £1.4 billion for Payment Protection Insurance (PPI) in Q3 FY19. The companyâs profit before taxation for Barclays International was £3.5 billion in Q3 FY19. The companyâs tangible net asset value (TNAV) was recorded at 274 pence per share by the end of Q3 FY19.
BARC-Share price performance
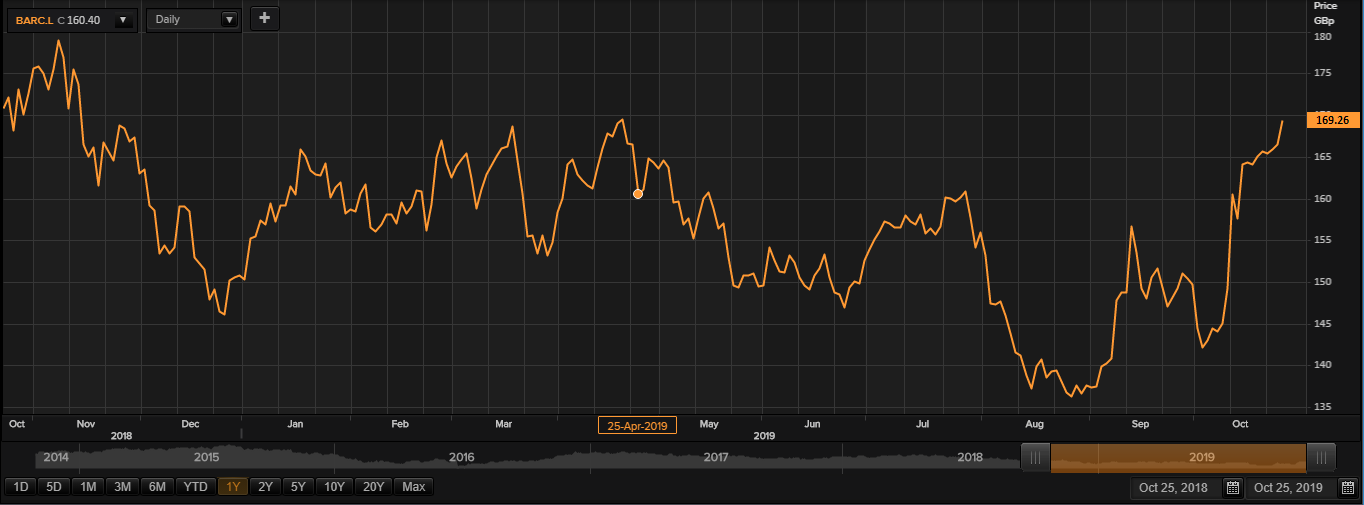
(Source: TR)
Before the market close, at the time of writing on 25th October 2019 at 10:07 AM GMT, BARC shares were hovering around GBX 169.26 and was up by 1.71 per cent against the previous day closing price.
Barclays PLC shares have recorded a high price of GBX 181.00 and a low price of GBX 131.04 in the last year. As quoted in the price chart, at the current trading price level, shares were hovering around 29.16 per cent higher from the 52-week low price mark.
4,006 trades took place today while writing and todayâs stock traded volume was recorded at 14,381,103.
