


Premier Oil Plc
Premier Oil Plc (PMO) is a London, the United Kingdom based Oil and Gas Production company that operates various oil and gas projects near the North Sea in South East Asia as well as Latin America. The organization's approach is to develop investor value by putting resources into top-notch creation and innovative openings while keeping up presentation to upside value from profitable investigation inside a severe capital order structure. The companyâs exploration and appraisal operations are mainly done from Alaska, Mexico and Brazil. The companyâs producing assets in the United Kingdom include the likes of the Balmoral Area in which the company has an operational interest as well as the Cather area, in which the company has a 50 per cent working interest.
PMO Operations Update
On 14th November 2019, the company announced a trading and operations update for the 10 months ended to 31st October 2019. The company highlighted that the group production stood at an average of 79.4 kilo barrels of oil equivalent per day for the reporting period with a very good operating efficiency of around 94 per cent. The company also reported that the management had predicted the full-year production at the upper end of the spectrum of 75 to 80 kilo barrels of oil equivalent per day (KBOEPD). The company also highlighted that the Catcher Area rates of gross 69 kilo barrels of oil equivalent per day and operating efficiency of almost a 100 per cent were maintained during the period which led to attaining project cash payback, 22 months after the first oil was extracted from the well. The company also pointed to significant industry interest in one of their assetsâ sale process of Block 7 Zama, which is in Mexico. It was reported that the bid deadline in relation to the sale process had been extended to December to accommodate and consider various levels of interest to deliver the highest value to the shareholders. The company also made a prediction of 2019 Operating expenditure, exclusive of any lease costs, and is anticipated to remain unchanged, previously estimated at US $12 per barrel of oil equivalent. The company also anticipates that the full-year capital expenditure estimates have been reduced to between US $300 million and US $320 million from the previous estimate of US $340 million. The company highlighted that the Net debt reduced by US $300 million during the period to US $2.03 billion as on 31st October 2019. The company also boosted the estimate for the full year reduction in the net debt estimates to be more than US $300 million.
| Group production breakdown | 1 Jan - 31 Oct 2019 | 1 Jan - 31 Oct 2018 |
| (KBOEPD) | (KBOEPD) | |
| Indonesia | 11.0 | 13.4 |
| Pakistan | 1.4 | 5.2 |
| UK | 55.3 | 43.5 |
| Vietnam | 11.7 | 15.6 |
| Total | 79.4 | 77.7 |
Source: Company Website
PMO Stock Price Performance
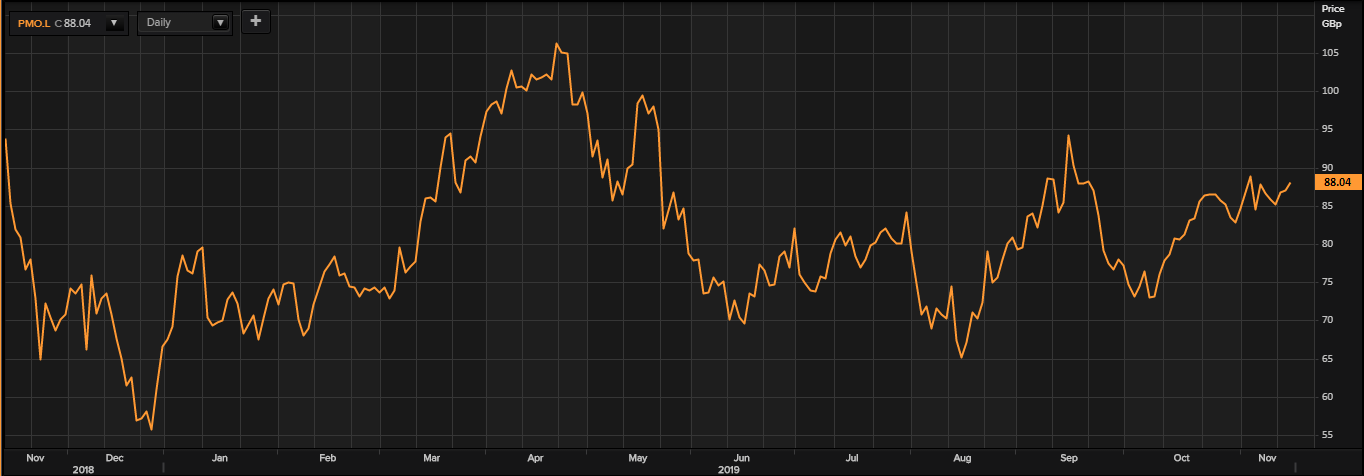
Daily Chart as at 15-November-19, after the market closed (Source: Thomson Reuters)
Â
On 15th November 2019, Premier Oil Plcâs share closed at GBX 88.04 per share, up by 1.265 per cent or GBX 1.10 per share against the previous day closing price. Premier Oil Plcâs Market Capitalization was reported at GBP 731.97 million.
The average volume of trading per day was of 2.9 million stocks. The stock has reportedly shown an upward change of 3.27 per cent in value in the last one year. There also has been a downward change in the last six months in the value of Premier Oil Plcâs stock of around 11.4 per cent. Premier Oil Plcâs stock has also reportedly gained 9.3 per cent in value in the last one month.
The beta of the Premier Oil Plcâs share has been reported to be at 3.37. This means that the companyâs share price movement is significantly more volatile in its trend, as compared to the benchmark market indexâs movement.
The Parkmead Group Plc
The Parkmead Group Plc (PMG) is an Aberdeen, the United Kingdom based oil and gas producer company. The company is engaged in the business of exploration and production of oil and gas. The company works through two divisions: oil and gas extraction and the generation division, which puts resources into oil and gas appraisals and creation of resources, as well as the energy economics segment, which gives energy economics and financial matters, the knowledge of economic evaluation as well as the benchmarking of supply, prompting on vitality strategies and monetary issues, undertaking monetary assessments, supply benchmarking administrations and training. The company has production from around four gas fields in the Netherlands and holds interests in roughly 40 exploration and production places.
PMG Financial Performance
On 15th November 2019, the company announced its preliminary results for the year ended 30th June 2019. The company reported that the revenue was up by around 18 per cent from £7.0 million in 2018 to £8.3 million in 2019. The company also stated that the cash flow from operations displayed a significant year on year growth of around 59 per cent from £3.0 million in 2018 to £4.7 million in 2019. The company also reported a 41 per cent increase in the gross profit to £5.7 million during the reporting period. This translated into an operating profit for the year that stood at £5.1 million as compared to an operating loss of £5.3 million reported in the previous year.
| Â Group statement of profit or loss for the year ended 30 June 2019 | 2019 | 2018 |
| £'000 | £'000 | |
| Â | Â | |
| Revenue | 8,269 | 7,022 |
| Cost of sales | -2,524 | -2,960 |
| Gross profit | 5,745 | 4,062 |
| Exploration and evaluation expenses | -171 | -5,244 |
| Administrative expenses | -436 | -4,153 |
| Operating profit / (loss) | 5,138 | -5,335 |
| Finance income | 209 | 92 |
| Finance costs | -546 | -645 |
| Profit / (loss) before taxation | 4,801 | -5,888 |
| Taxation | -2,385 | -1,259 |
| Profit / (loss) for the year attributable to the equity holders of the Parent | 2,416 | -7,147 |
| Â | Â | |
| Earnings / (loss) per share (pence) | Â | |
| Basic | 2.44 | -7.22 |
| Diluted | 2.43 | -7.22 |
Source: Company Website
PMG Stock Price Performance
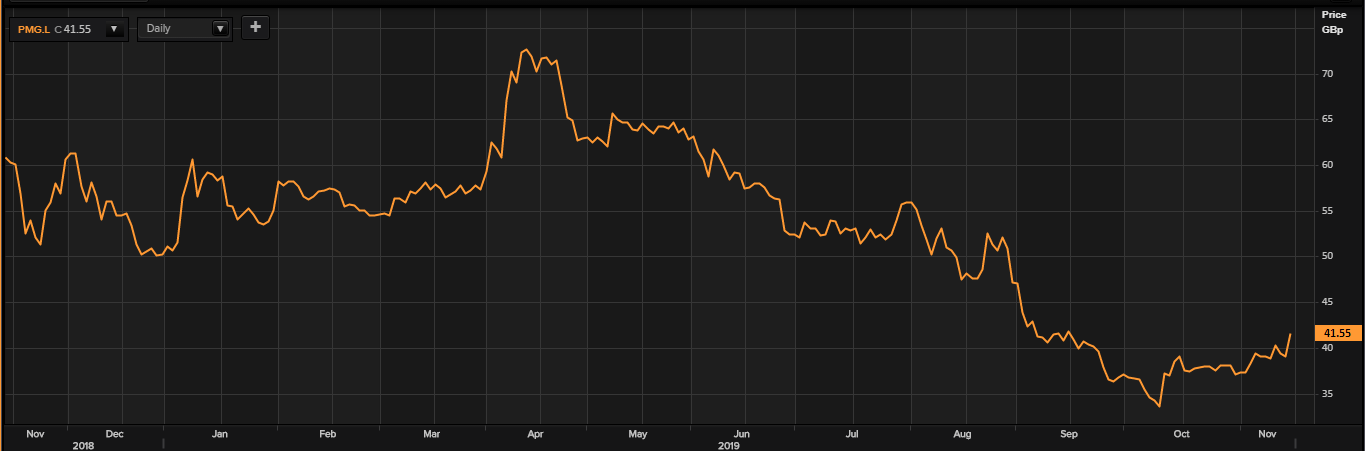
Daily Chart as at 15-November-19, after the market closed (Source: Thomson Reuters)
On 15th November 2019, The Parkmead Group Plcâs share closed at GBX 41.55 per share, an increase of 7.436 per cent or GBX 2.90 per share as compared to the previous dayâs closing price. The Parkmead Group Plcâs Market Capitalization was reported at GBP 45.11 million.
The average volume of trading per day was of 545,038 stocks. The stock has reportedly shown a downward change of 30.98 per cent in value in the last one year. There also has been a downward change in the last six months in the value of The Parkmead Group Plcâs stock of around 35.58 per cent. The Parkmead Group Plcâs stock has also reportedly gained 6.53 per cent in value in the last one month.
The beta of the Parkmead Group Plcâs share has been reported to be at 0.90. This means that the companyâs share price movement is less volatile in its trend, as compared to the benchmark market indexâs movement.
