


Global Markets*: Equities at the Wallstreet were trading in red on the last trading session of this week (before the market close at 06:30 PM GMT), with the Dow Jones Industrial Average Index was down by 110.71 points or 0.41% to 26,780.41, the broader S&P 500 index contracted by 22.53 points or 0.76% to 2,955.09 and the technology benchmark index Nasdaq Composite declined significantly to 7,928.33, down by 102.33 points or 1.27% respectively.
Global News: Wells Fargo & Co. (WFC) announced BNY Mellonâs Charles Scharf as Chief Executive Officer, reporting new era in the bankâs effort to turn it around. At the New York Stock Exchange, shares of WFC were trading 2.05 points or 4.19% higher at US$ 50.92. Both S&P and Nasdaq contracted sharply after the news released that the White House might limit capital flows to China.
NASDAQ Composite (IXIC)*
Top Performers: NantHealth Inc, The9 Ltd and Recon Technology Ltd are top gainers and increased by 16.92%, 16.67% and 14.86% respectively.
Worst Performers: AzurRx Biopharma Inc, Concert Pharmaceuticals Inc and Histogenics Inc are the top three laggards and decreased by 21.53%, 17.53% and 14.38% respectively.
Top Performing Sectors: Financials (up 0.56%), Industrials (up 0.29%) and Consumers Cyclicals (up 0.15%).
Worst Performing Sectors: Technology (down 0.21%), Basic Materials (down 0.23%) and Telecommunication services (down 0.35%).
S&P 500 (SPX)*
Top Performers: Nektar Therapeutics, Wells Fargo & Co and Macyâs Inc are top gainers and increased by 4.73%, 4.62% and 3.08% respectively.
Worst Performers: Micron Technology Inc, Bank of New York Mellon Corp and Lam Research Corp are the top three laggards and decreased by 7.39%, 3.56% and 3.38% respectively.
Dow Jones Industrial Average (DJI)*
Top Performers: Walgreens Boots Alliance Inc, JP Morgan Chase & Co and United Health Group Inc are top gainers and increased by 1.28%, 1.19% and 1.09% respectively.
Worst Performers: Walt Disney Co, Travelers Companies Inc and Merck & Co Inc are the top three laggards and decreased by 0.45%, 0.30% and 0.30% respectively.
European Markets: The Londonâs broader equity benchmark index FTSE 100 traded at 75.13 points or 1.02% higher at 7,426.21, the FTSE 250 index snapped 152.34 points or 0.77% higher at 19,970.95, and the FTSE All-Share Index ended 39.73 points or 0.98% higher at 4,071.29 respectively. Another European equity benchmark index STOXX 600 ended at 391.79, up by 1.84 points or 0.47 per cent.
European News: A senior official at the central bank said that the Bank of England might have to consider a rate cut even if Britain avoids a disorderly Brexit, as European Commission data showed further weakness in the economy. Britainâs Financial Conduct Authority (FCA) is assessing some peer-to-peer lenders post gauging a number of screw-ups ahead of the introduction of stringent new regulations later this year.
London Stock Exchange*
Top Performers: METRO BANK PLC (MTRO), IP GROUP PLC (IPO) and INTU PROPERTIES PLC (INTU) are top gainers and increased by 15.24%, 10.65% and 7.82% respectively.
Worst Performers: SIRIUS MINERALS PLC (SXX), HOCHSCHILD MINING PLC (HOC) and TOPPS TILES PLC (TPT) are the top three laggards and decreased by 20.89%, 5.03% and 4.25% respectively.
FTSE 100 Index*
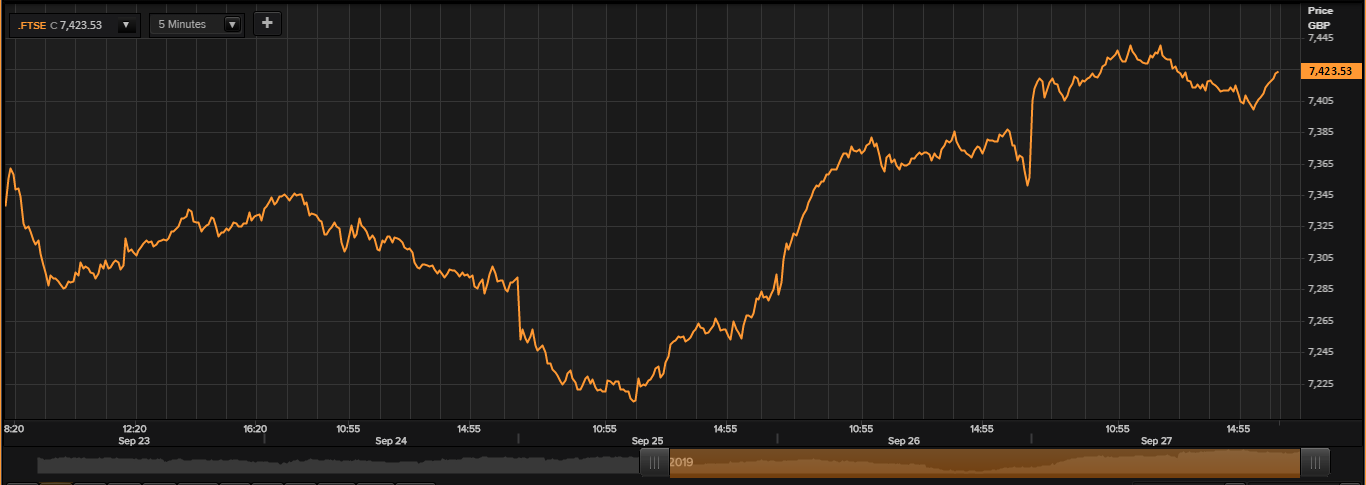
  (Source: Thomson Reuters) Price Performance in Last Five days (September-27-2019), before the market closed
Top Gainers: PERSIMMON PLC (PSN), SMURFIT KAPPA GROUP PLC (SKG) and KINGFISHER PLC (KGF) are top gainers and increased by 5.13%, 3.55% and 3.42% respectively.
Top Laggards: FRESNILLO PLC (FRES), POLYMETAL INTERNATIONAL PLC (POLY) and IMPERIAL BRANDS PLC (IMB) are top losers and decreased by 3.62%, 2.38% and 1.44% respectively.
Volume Leaders: (LLOY) LLOYDS BANKING GROUP PLC; (VOD) VODAFONE GROUP PLC; (GLEN) GLENCORE PLC.
Top Performing Sectors: Energy (up 1.76%), Basic Materials (up 1.51%), and Financials (up 1.28%).
Currency Exchange Rates*: GBP/USD and EUR/GBP were quoting at 1.2312 and 0.8890.
US and UK 10-Year Bond Yields*: The US 10-year and the UK 10-year Bond yields were quoting at 1.696% and 0.499% respectively.
Â
*At the time of writing.
