


Balfour Beatty Plc
Balfour Beatty Plc (BBY) is a provider of infrastructure solutions related to management services, maintenance and upgradation in road and railways, utility infrastructure and power transmission. The companyâs operations are divided into three reportable segments being Construction Services, Support Services and Infrastructure Investments.
The Construction Services segment is engaged in the activities related to the assetâs physical construction. The company operates its construction business in the United States and the United Kingdom.
The Support Services business is engaged in the activities related to support of existing assets, including refurbishment and maintenance. The companyâs Support Services business is responsible for maintaining, upgrading and managing of national infrastructure.
The companyâs Infrastructure Investments business is engaged in the activities related to acquisition and disposal of infrastructure properties which includes waste and biomass, offshore transmission networks, student accommodation, military housing, schools, roads, hospitals and other concessions. The companyâs housing development division is also a part of Infrastructure Investments segment.
Recent News
On 14th August 2019, Balfour Beatty announced its interim results ending for the six -month period 28th June 2019.
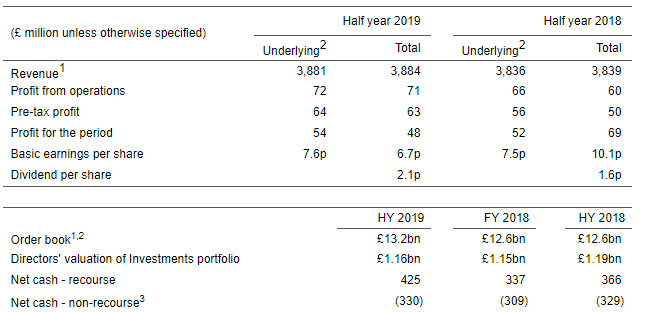
Financial Highlights â First Half Financial Year 2019 (£, million)
(Source: Interim Report, Company Website)
 For the H1 of the Financial year 2019, Balfour Beatty Plcâs underlying revenue stood at £3,881 million as against £3,836 million for the same period of the prior year.  The companyâs total revenue was at £3,884 million in the H1 of the financial year 2019 as against £3,839 million in the H1 of the financial year 2018.
The groupâs EBIT (adjusted) for the first half of FY2019 stood at £72 million as compared to £66 million reported in H1 FY2018. The groupâs Reported operating profit for H1 FY2019 stood at £71 million as compared to £60 million reported in H1 FY2018.
The groupâs adjusted PBT (Profit before tax) for H1 FY2019 stood at £ 64 million as compared to £56 million reported in H1 FY2018. The groupâs Reported PBT for the first half of FY2019 stood at £63 million as compared to £50 million reported in H1 FY2018.
The profit (adjusted) for the year stood at £54 million in H1 FY2019 against £52 million in H1 FY2018. The profit (reported) for the year stood at £48 million in H1 FY2019 against £69 million in H1 FY2018.
The adjusted Basic earnings per share stood at 7.6 pence in H1 FY2019 as compared to 7.5 pence in H1 FY2018. The Basic earnings per share stood at 6.7 pence in H1 FY2019 as compared to 10.1 pence in H1 FY2018. The Diluted earnings per share stood at 6.6 pence in H1 FY2019 as compared to 10 pence in H1 FY2018.
The companyâs interim dividend for the H1 FY2019 was up by 31 per cent to 2.1 pence as against 1.6 pence in H1 FY2018. The average net cash was at £290 million in the first half of FY2019 versus £161 million in the H1 FY2018.
The companyâs order book was up by 5 per cent to £13.2 billion in H1 FY2019 from £12.6 billion in H1 FY2018.
Balfour Beatty Plc Share Price Performance
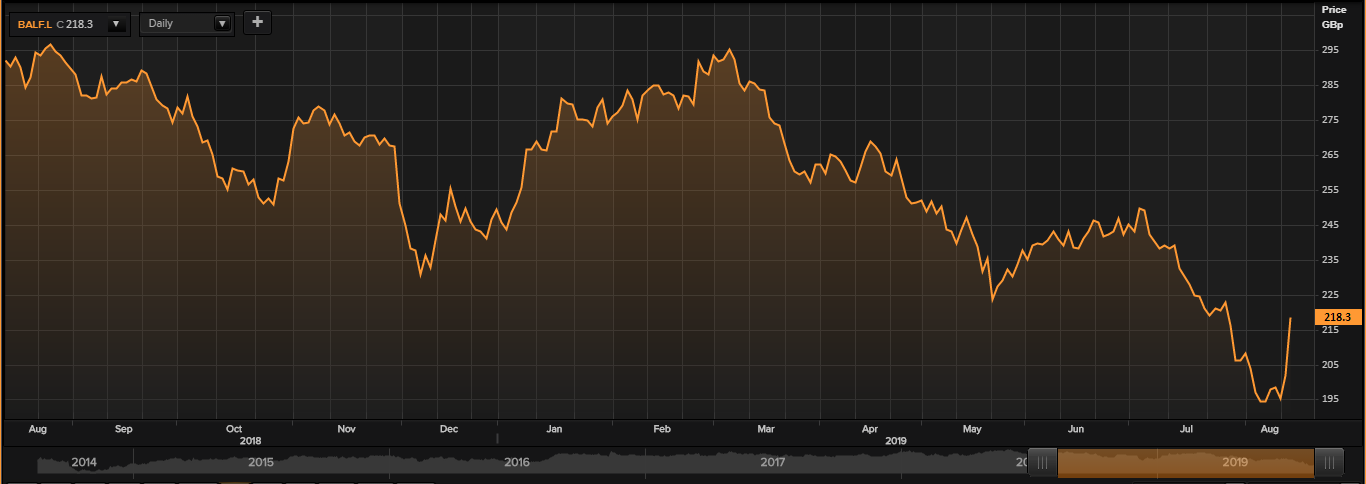
Daily Chart as at August-14-19, before the market close (Source: Thomson Reuters)
On August 14, 2019, at the time of writing (before the market close, at 2:43 PM GMT), Balfour Beatty Plc shares were trading at GBX 218.30, up by 8.18 per cent against the previous dayâs closing price. Stock's 52-week High and Low are GBX 301.70/GBX 192.30. At the time of writing, the shares were trading lower than the 52-week High by 27.64 per cent and 13.52 per cent higher than the 52-week low. Stockâs average traded volume for 5 days was 1,213,004.00; 30 days â 1,369,094.53 and 90 days â 1,526,352.64. The traded volume (average) for 5 days declined by 11.40 per cent as compared to 30 days average traded volume. The companyâs stock beta as on date was 0.78, reflecting lower volatility as compared to the benchmark index. The outstanding market capitalisation was around GBX 1.39 billion, with a dividend yield of 2.38 per cent.
Horizonte Minerals Plc (HZM)
Horizonte Minerals Plc (HZM) is a UK based mining company majorly focused on nickel development. The company holds interest in northern Brazil-based Araguaia nickel laterite venture situated on the southern part of Carajas mineral district. The company also owns the Vermelho project of nickel-cobalt. The group is focussed on developing Araguaia into a major ferronickel mine in Brazilian region with production to start by the year 2022. The company has a robust institutional shareholder structure which includes Glencore, Hargreaves Lansdown, JP Morgan, Lombard Odier Asset Management (Europe) Ltd, Richard Griffiths, Canaccord Genuity Group and Teck Resources Ltd. The management team has a wide experience in both the Brazilian market and in the nickel industry.
Recent News
On 14th August 2019, Wednesday, Horizonte Minerals announced its interim results for the period ending 30th June 2019.
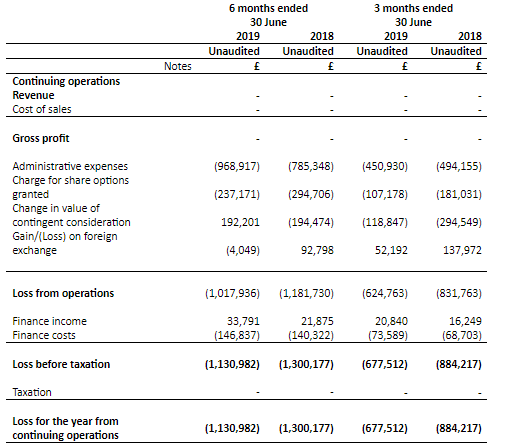
Financial Highlights â First half Financial Year 2019 (£)
(Source: Interim Report, Company Website)
The groupâs Administrative expenses stood at £450,930 in Q2 FY2019 as against £494,155 in Q2 FY2018. The companyâs Administrative expenses stood at £968,917 in H1 FY2019 as against £785,348 in H1 FY2018. The companyâs share options grant charge was at £237,171 in H1 FY2019 versus £294,706 in H1 FY2018. The share options grant charges in Q2 FY2019 stood at £107,178 versus £181,031 in Q2 FY2018.
The companyâs loss from operations for Q2 FY2019 stood at £624,763 as against an operating loss of £831,763 in Q2 FY2018. The companyâs loss from operations for the first half of the Financial Year 2019 stood at £1,017,936 as against an operating loss of £1,181,730 in the first half of the FY 2018.
The companyâs loss before and after-tax for Q2 FY2019 stood at £677,512 as against loss before and after-tax of £884,217 in Q2 FY2018. The companyâs loss before and after-tax for the first half of the Financial Year 2019 stood at £1,130,982 as against loss before and after-tax of £1,300,177 in the first half of the FY 2018.
The companyâs basic and diluted loss per share for Q2 FY2019 stood at 0.047 pence as against loss per share of 0.062 pence in Q2 FY2018. The companyâs basic and diluted loss per share for the first half of the Financial Year 2019 stood at 0.078 pence as against loss per share of 0.091 pence in the first half of the Financial Year 2018.
Horizonte Minerals Plc Share Price Performance
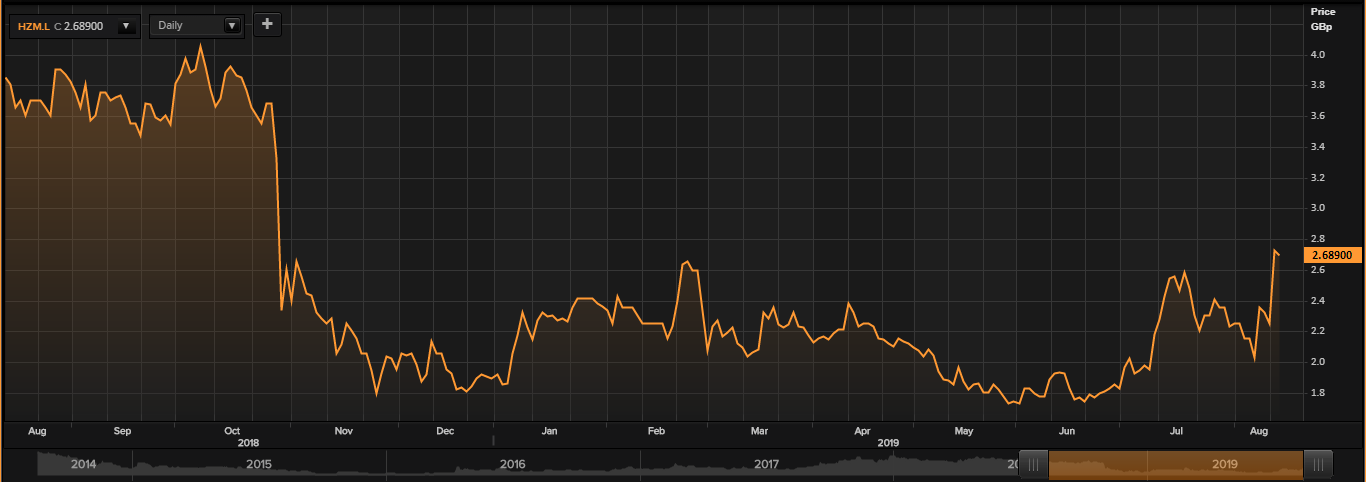
Daily Chart as at August-14-19, before the market close (Source: Thomson Reuters)
On August 14, 2019, at the time of writing (before the market close, at 2:50 PM GMT), Horizonte Minerals Plc shares were trading at GBX 2.689, down by 1.32 per cent against the previous dayâs closing price. The stockâs 52-weeks High and Low are GBX 4.10/GBX 1.66. At the time of writing, the share was trading 34.41 per cent lower than the 52-week High and 61.99 per cent higher than the 52-week low. Stockâs average traded volume for 5 days was 12,919,057.40 ; 30 days â7,186,011.13 and 90 days â 6,202,914.39. The traded volume (average) for 5 days was up by 79.78 per cent as compared to 30 daysâ average traded volume. The companyâs stock beta was 2.44, reflecting higher volatility as compared to the benchmark index. The outstanding M cap (market capitalisation) was around GBX 40.01 million.
Lookers Plc (LOOK)
Lookers PLC (LOOK) is an Altrincham, the United Kingdom-based group, which operates as motor retail and aftersales company. The companyâs business is differentiated in three division: Automotive, Agricultural and Leasing. The company's operations cover all four UK countries and the Republic of Ireland where it functions through the sale of new and used cars and aftersales services.
Recent News
On 14th August 2019, Lookers announced its interim results for the half-year ending June 2019.
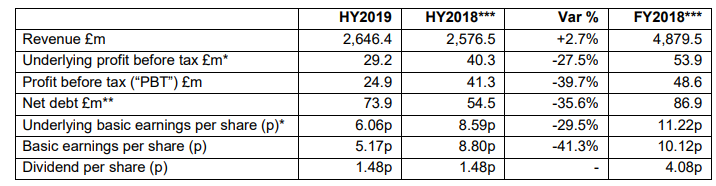
Financial Highlights â First Half Financial Year 2019 (£, million)
(Source: Interim Reports, Company Website)
In H1 FY2019, the total revenue increased by 2.7 per cent to £2,646.4 million as compared with the same period of the last year, due to an increase in both used cars and aftersales. Like-for-like revenue growth was of 0.1 per cent during the period. Underlying PBT reduced by 27.5 per cent to £29.2 million against the £40.3 million in H1 FY18, due to a challenging market backdrop. Profit before tax stood at £24.9 million, a decrease of 39.7 per cent from the previous year same period data. Underlying basic earnings per share reduced by 29.5 per cent to 6.06 pence against the 8.59 pence in H1 FY18. Basic earnings per share were 5.17 pence, a decrease of 41.3 per cent as compared with the corresponding period of the last year. The company had a strong balance sheet with net debt of £73.9 million, a decrease from £86.9 million at 31st December 2018. Interim dividend per share stood at 1.48 pence and remain flat against the same period in 2018. Netbook value was £312.1 million.
Lookers Plc Share Price Performance
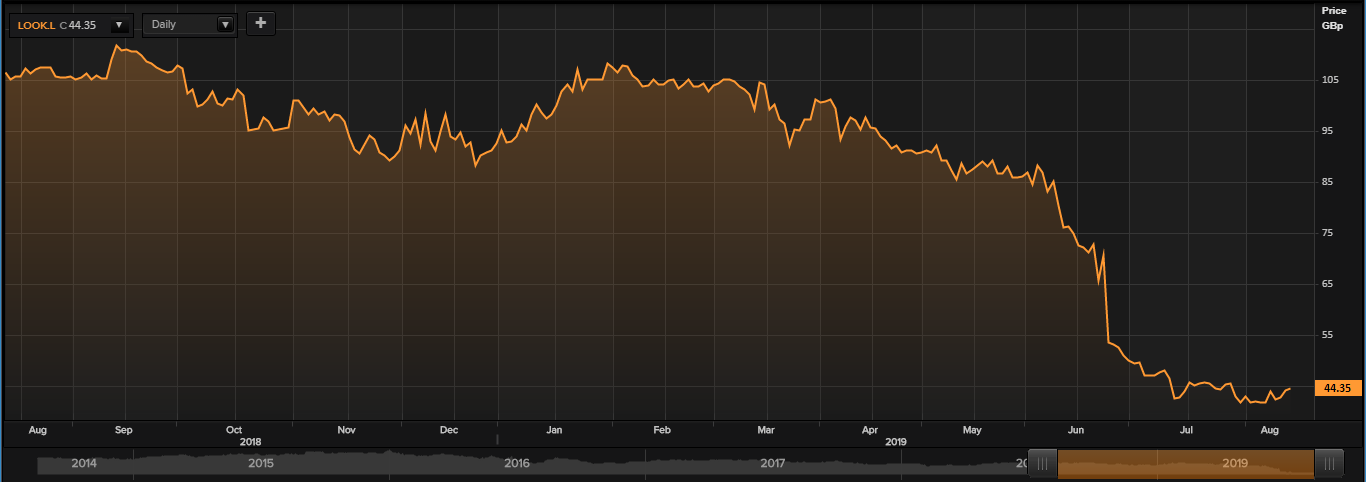
Daily Chart as at August-14-19, before the market close (Source: Thomson Reuters)
On August 14, 2019, at the time of writing (before the market close, at 2:56 PM GMT), Lookers Plc shares were trading at GBX 44.35, up by 0.79 per cent against the previous dayâs closing price. Stock's 52 weeks High and Low are GBX 113.60/GBX 33.70. At the time of writing, the shares were trading lower than the 52-week High by 60.96 per cent and higher than the 52-week low by 31.60 per cent. Stockâs traded volume (average) for 5 days was 365,041.80; 30 days â 1,594,725.53 and 90 days â 956,355.08. The traded volume (average) for 5 days was down by 77.11 per cent as against to 30 days average traded volume. The companyâs stock beta was 0.54, reflecting low volatility as compared to the benchmark index. The outstanding market capitalisation was around GBX 171.48 million, with a dividend yield of 9.27 per cent.
Â
Comparative share price chart of BBY, HZM & LOOK
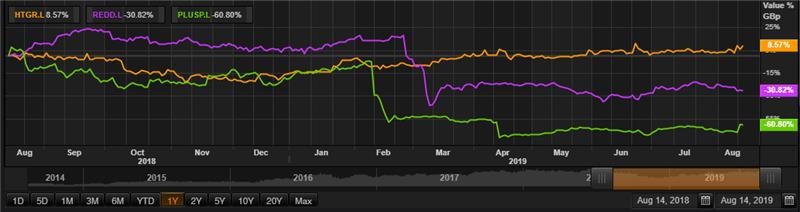
(Source: Thomson Reuters)
