

_07_03_2026_03_50_21_133108.jpg)

IG Group Holdings PLC (LON:IGG)
United Kingdom-based, IG Group Holdings PLC provide traders with fast and flexible access to the financial markets through its range of dealing platforms and applications. The company has presence across 15 plus countries is the leading provider of contract for difference (CFDs) globally. The company provides with an option of leveraged trading with access to 16,000 plus financial markets and wealth-management products.
IGG-Pre-Close Trading Update for H1 FY20
The companyâs Net trading revenue in the first half of the fiscal year 2020 is expected to be approximately £250 million. The Revenue in the company's core markets is expected to be around £210 million in the first half of the fiscal year 2020. The company is expected to release its financial results for the first half of the fiscal year 2020 on 21 January 2020.
IGG-Financial highlights for FY19
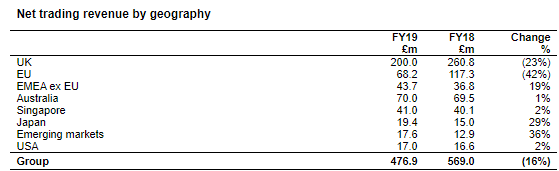
(Source: London Stock Exchange)
The companyâs PBT (Profit before tax) stood at £194.3 million in FY 2019 versus £280.8 million in FY 2018. The profit for the year attributable to the shareholders was £158.3 million in FY 2019 versus £226.4 million in FY 2018. The companyâs basic earnings per share for the FY 2019 was down by 30% to 43.1 pence from 61.7 pence in FY 2018. The companyâs diluted earnings per share for the FY 2019 stood at 42.8 pence versus 61.2 pence in FY 2018.
The companyâs net trading revenue for the financial year ending 31st May 2019 declined by 16 per cent to £476.9 million as against £569.0 million in FY18. The decline in revenue was reflected by the impact created due to ESMA measures and unfavourable market conditions. The companyâs net operating income stood at £477.2 million in FY 2019 versus £571.2 million in FY 2018. In the financial year 2019, the companyâs operating profit was reported at £192.9 million as against £281.1 million in FY 2018.
IGG-Dividend
The last IG Group Holdings final dividend stood at 30.24 pence per share and it was paid on 24th October 2019. The company has been consistent in paying dividends to shareholders.
IGG-Stock price performance
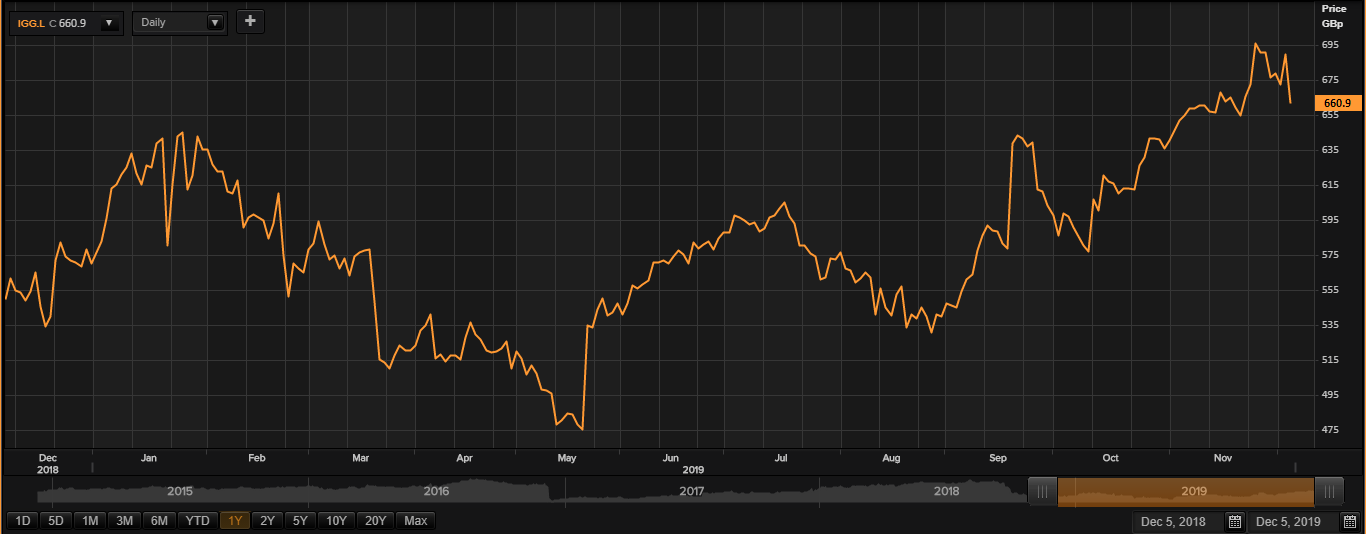
(Source: Thomson Reuters)
On 05th December 2019, at the time of writing (before the market closed, GMT 11:12 AM), IGG shares were trading at GBX 660.90 on the London Stock Exchange. Stock's 52 weeks High and Low is GBX 696.20/GBX 467.40. The company's stock beta was 0.19, reflecting less volatility as compared to the benchmark index. Total outstanding market capitalisation was around GBP 2.54 billion, with a dividend yield of 6.27 per cent.
Â
DS Smith PLC (LON:SMDS)
London, United Kingdom-based DS Smith PLC is a multinational packaging company. The group comprises of plastic packaging globally and a leading provider of corrugated packaging. The groupâs packaging business is differentiated in six segments: The United Kingdom, DCH & Northern Europe, Western Europe, North America, Central Europe & Italy, and Plastics.
SMDS-Dividend
The last DS Smith PLC final dividend stood at 11 pence per share and shares went ex-dividend on 03rd October 2019, and it was paid on 01st November 2019. The company has been consistent in paying dividends to investors.
SMDS-Financial highlights H1 FY20
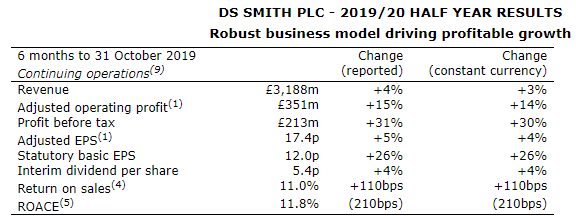
(Source: London Stock Exchange)
The companyâs revenue was up by 3 per cent on constant currency basis to £3,188 million in the first half of fiscal year 2020. The companyâs adjusted operating profit was up by 14 per cent on constant currency basis to £351 million in the first half of fiscal year 2020. The profit before taxation of the company was up by 30 per cent on constant currency basis to £213 million in the first half of fiscal year 2020. The companyâs adjusted EPS was up by 4 per cent on constant currency basis to 17.40 pence in the first half of fiscal year 2020. The companyâs statutory basic EPS was up by 26 per cent on constant currency basis to 12 pence in the first half of fiscal year 2020. The companyâs interim dividend was up by 4 per cent on constant currency basis to 5.4 pence per share in the first half of fiscal year 2020.       Â
SMDS-Stock price performance
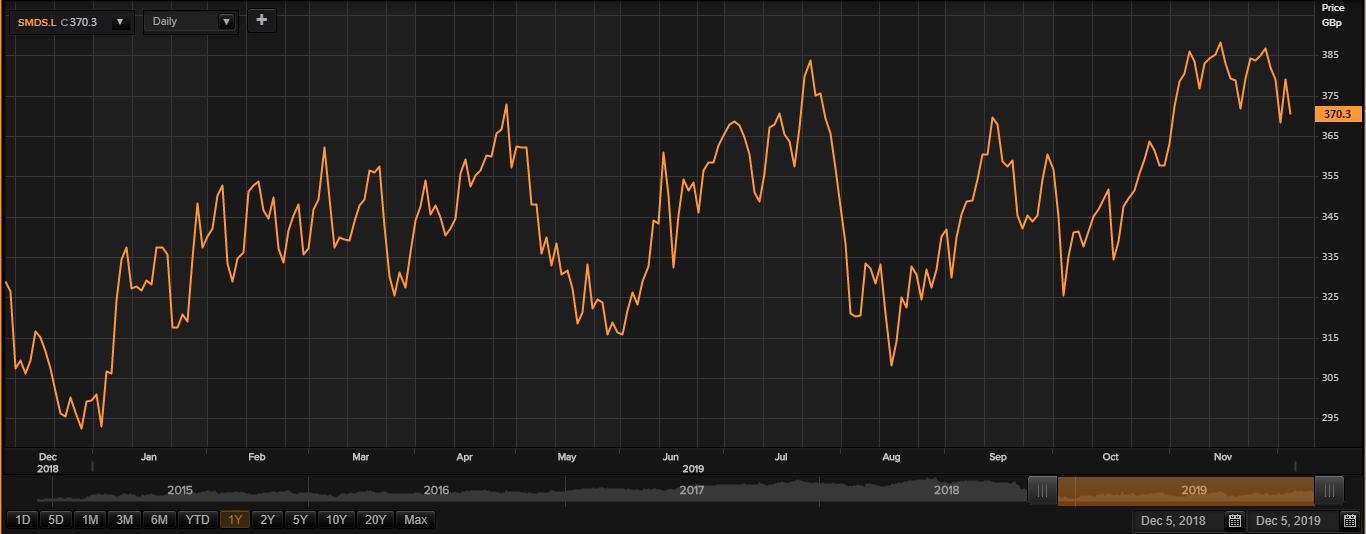
(Source: Thomson Reuters)
Â
On 05th December 2019, at the time of writing (before the market closed, GMT 11:14 AM), SMDS shares were trading at GBX 370.30 on the London Stock Exchange. Stock's 52 weeks High and Low is GBX 390.00/GBX 285.83. The company's stock beta was 1.11, reflecting more volatility as compared to the benchmark index. Total outstanding market capitalisation was around GBP 5.2 billion, with a dividend yield of 4.28 per cent.
Victrex PLC (LON:VCT)
London Stock Exchange-traded Victrex Plc is a UK-headquartered holding company. Its operational interest lies in manufacturing and sale of various speciality chemicals and its areas of operations are divided into segments like Industrial and Medical.
VCT-Dividend
The last Victrex Plc interim dividend was recorded at 13.42 pence per share and the shares went ex-dividend on 06th June 2019, and it was paid on 28th June 2019. The company has been consistent in paying dividends to investors.
VCT-Business performance for FY19 period ended 30th September 2019
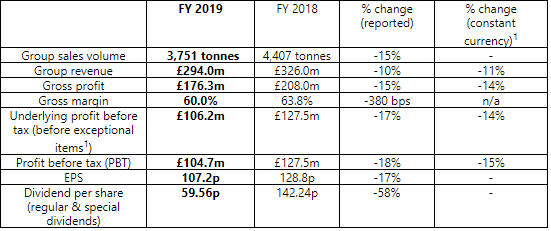
(Source: London Stock Exchange)
The companyâs revenue was recorded at £294 million in the Financial Year 2019, was down by 10 per cent from £326 million in the fiscal year 2018, as it was impacted by the weaker trading performance. The companyâs revenue in constant currency was down by 11 per cent in the Financial Year 2019. Medical continued to show some growth with an improved sales mix.
The sales volume of the company was down by 15 per cent to 3,751 tonnes in the fiscal year 2019 as compared to 4,407 tonnes in the Financial Year 2018, reflecting the cyclicality in Automotive and the associated impact on the Value Added Resellers segment, coupled with de-stocking, with supply chain inventories on a lower side. The company witnessed an impact from the Electronics market going weaker, with both Semiconductor and smartphone markets down.
The sales volume in the fourth quarter of 2019, stood at 940 tonnes, which was 5 per cent lower than the comparative period in 2018 (sales volume: 990 tonnes) but slightly improved in the third quarter of 2019, which indicates some sort of stabilisation in the Automotive and Electronics end markets in the final quarter, although the company was prudent in its near-term outlook.
VCT-Stock price performance
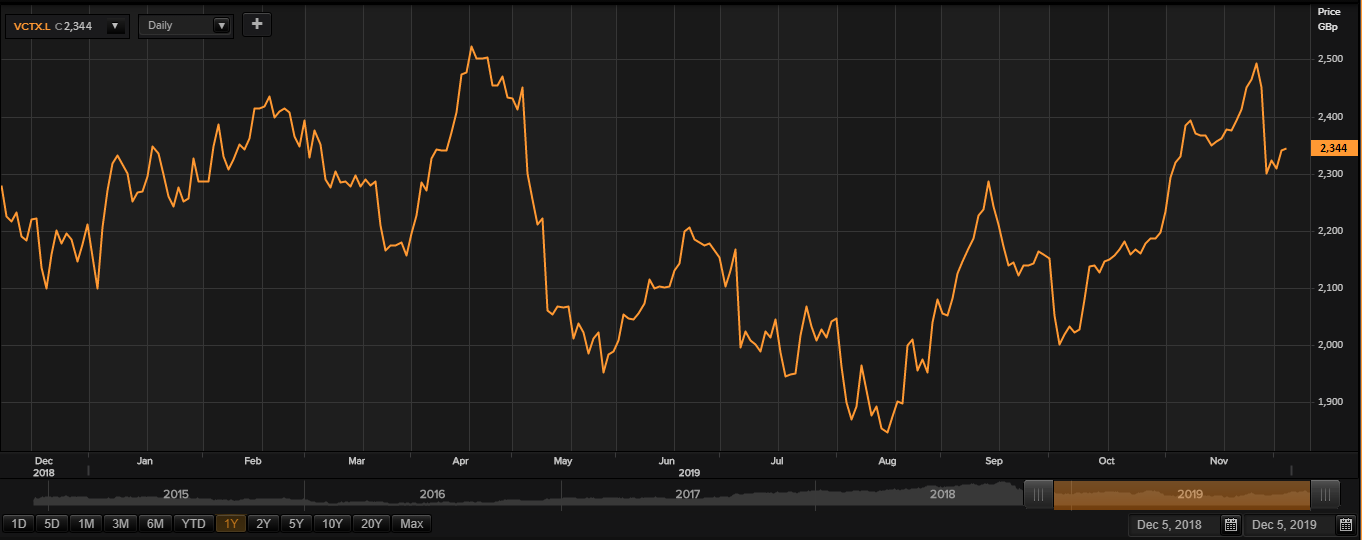
(Source: Thomson Reuters)
On 05th December 2019, at the time of writing (before the market closed, GMT 11:17 AM), VCT shares were trading at GBX 2,344 on the London Stock Exchange. Stock's 52 weeks High and Low is GBX 2,551.39/GBX 1,813.68. The company's stock beta was 1.24, reflecting more volatility as compared to the benchmark index. Total outstanding market capitalisation was around GBP 2.02 billion, with a dividend yield of 2.55 per cent.
AJ Bell PLC (LON:AJB)
AJ Bell PLC is one of the largest providers of investment platforms in the United Kingdom. The company is having a customer base of more than 200,000 people and handling assets more than £50 billion. AJ Bell Platinum, AJ Bell Media, AJ Bell Investments, AJ Bell Investcentre, AJ Bell Youinvest and AJ Bell Securities are the major products and services offerings of the group.
AJB-Dividend
The last AJ Bell PLC interim dividend was recorded at 1.5 pence per share and it went ex on 06th June 2019, and it was paid on 28th June 2019. The company has been consistent in paying dividends to investors.
AJB-Business performance for FY19 period ended 30th September 2019
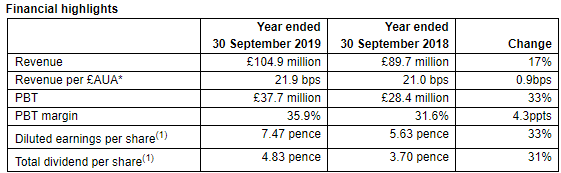
(Source: London Stock Exchange)
The companyâs revenue was up by 17 per cent to £104.9 million in the financial year 2019 as compared to £89.7 million in the financial year 2018. The companyâs profit before taxation was up by 33 per cent to £37.7 million in the financial year 2019 as compared to £28.4 million in the financial year 2018. The companyâs balance sheet improved as the net assets were up to £86.1 million in the financial year 2019 as compared to £64 million in the financial year 2018. The company announced a final dividend of 3.33 pence per share, taking the annual dividend to 4.83 pence per share in the financial year 2019. The companyâs retail customers increased by 17 per cent to 232,066 in the financial year 2019 from 197,912 in the financial year 2018. The companyâs customer retention ratio stood at 0.95 in the Financial Year 2019, which remained flat in comparison to the previous year.
AJB-Stock price performance
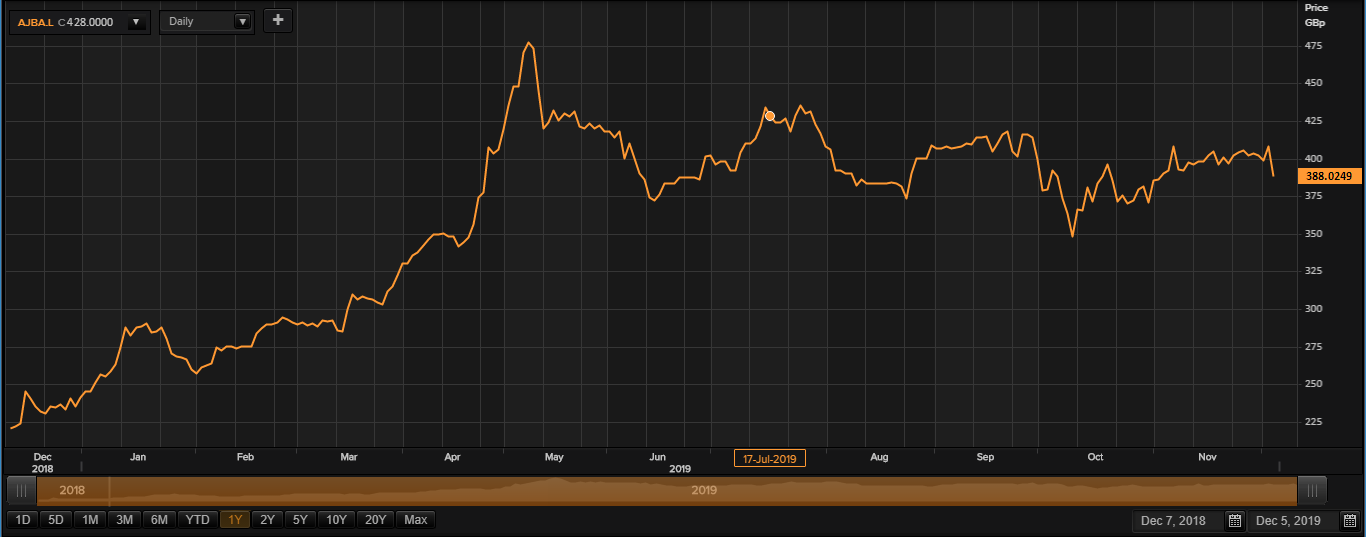
(Source: Thomson Reuters)
On 05th December 2019, at the time of writing (before the market closed, GMT 11:19 AM), AJB shares were trading at GBX 388.02 on the London Stock Exchange. Stock's 52-week High and Low is GBX 483.08 /GBX 162.00. The company's stock beta was 0.86, reflecting lesser volatility as compared to the benchmark index. Total outstanding market capitalisation was around GBP 1.66 billion.
