


_07_03_2026_03_50_21_133108.jpg)

BT Group Plc
BT Group Plc (BT.A) is a London, the United Kingdom based Telecommunications company, that engages in the business of providing Fixed Line Telecommunications as well as various other services. The companyâs other services include the likes of broadband and internet services, mobile and television products as well as broadcasting services and information technology solutions. The company is also in the business of running various broadcasting channels on the television, which include the famous networks like the BT sport, the BT news and some other BT networks. The company operates its consumer segment through around 620 stores and has approximately 30 million customers, under the pretext of three of its brands called, BT, EE as well as PlusNet. The companyâs Enterprise business serves around 1.2 million businesses in the United Kingdom as well as the Republic of Ireland to provide mass-market services like payphones and directory enquiries amongst others. The companyâs global business operations include mainly providing Information technology solutions as well as cybersecurity services to approximately 180 countries in the world.
BT.A Financial Performance
On 31st October 2019, the company announced its interim results for the half-year ended 30th September 2019. The company reported a revenue of £11,467 million, a decline of 1 per cent year on year was primarily driven by the effect of regulation as well as a decline in revenues from legacy products. The companyâs profit before tax and profit after tax remained flatlined as compared to the previous year with profit before tax reported at £1,333 million while profit after tax reported at £1,068 million. The company reported its basic earnings per share at a marginal increase of around 2 per cent year on year from GBX 10.6 per share in the first half of previous year to GBX 10.8 per share in the reported period.
| Half year to 30 September | 2019 | 2018 | 2018 | Change |
| (IFRS 16) | (IAS 17) | (IFRS 16 pro forma) | ||
|  | £m | £m | £m | % |
| Reported measures | Â | |||
| Revenue | 11,467 | 11,588 | -1 | |
| Profit before tax | 1,333 | 1,340 | n/m | |
| Profit after tax | 1,068 | 1,052 | n/m | |
| Basic earnings per share | 10.8p | 10.6p | 2 | |
| Net cash inflow from operating activities | 2,173 | 754 | 188 | |
| Interim dividend | 4.62p | 4.62p | - | |
| Capital expenditure | 1,882 | 1,833 | 3 | |
| Â | Â | |||
| Adjusted measures | Â | |||
| Adjusted revenue | 11,413 | 11,624 | 11,624 | -2 |
| Adjusted EBITDA | 3,923 | 3,675 | 4,038 | -3 |
| Normalised free cash flow | 604 | 974 | 974 | -38 |
| Net debt | 18,347 | 11,895 | n/m |
Source: Company Website
BT.A Stock Price Performance
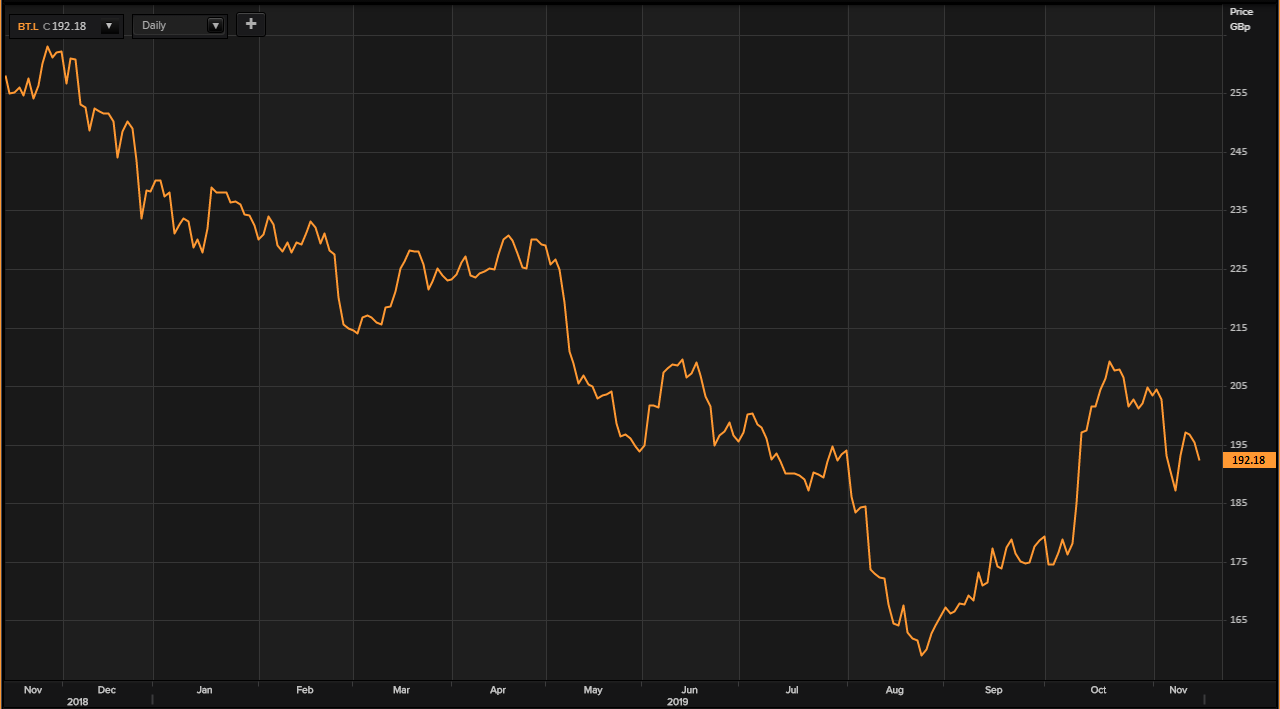
(Source: Thomson Reuters)
On 15th November 2019, at 08:40 A.M GMT, at the time of writing, BT Group Plc âs stock price has been reported to be trading at GBX 192.18 per stock, a decrease of 1.57 per cent or GBX 3.06 per stock as compared to the previous dayâs closing price, which has been reported at GBX 195.24 per stock. At the time of writing, the BT Group Plc stock price has been reported to be trading 21.88 per cent above the 52-week low stock price, which was at GBX 157.67 per stock, set on August 27, 2019. This was also 28.29 per cent below the 52-week high price at GBX 268.00 per stock, which the companyâs stock set on November 28, 2018. The reported Market Capitalization of BT Group Plc has been at GBP 19.293 billion.
At the time of writing, 2.28 million of the companyâs stocks had been traded in the market. The average volume of trading per day, for the last one year in the market, was 13.17 million stocks. The stock has reportedly shown a downward change of 24.60 per cent in value in the last one year, from the price of GBX 254.9 per stock. There also has been a downward change in the last six months in the value of BT Group Plcâs stock of around 6.34 per cent from the stock price of GBX 205.2 per stock. BT Group Plcâs stock has also reportedly lost 4.62 per cent in value in the last one month from the price of GBX 201.50 per stock.
The beta of the BT Group Plcâs stock has been reported to be at 0.82. This means that the companyâs stock price movement is less volatile in its trend, as compared to the benchmark market indexâs movement.
Vodafone Group Plc
Vodafone Group Plc (VOD) is a London, the United Kingdom based telecommunications company. Through subsidiary undertakings, joint ventures, associated undertakings and investments, the company runs its operations in Europe, Asia Pacific, Africa and the Middle East. The group is among the world's driving media communications companies and has in excess of 500 million clients around the globe. The organization offers a wide extent of services to both individual and business clients across 26 nations and fixed services in 17 of them. The group is a sector lead in carrier services, security and IOT cloud to its enterprise clients, and also offers Mobile, Fixed and TV services to its purchaser clients. The organization is largely working in two geographic locations, Europe and AMAP (Africa, the Middle East and the Asia Pacific) which encompass 27 nations. To broaden their span past the organisations they have an association accord with nearby administrators in 40 nations. They are among the best five internet services providers internationally and perhaps the biggest administrator of submarine links. The organization is situated in Newbury, the United Kingdom and was established in 1984. Vodafone Plc works the world over with tasks in more than twenty-five countries. It additionally has organization accord in over forty countries around the globe nearby running in the fixed broadband space in roughly twenty nations. Toward the close of the first quarter of FY 2020 (period ending June 30, 2019), the organization has somewhere around 640 million clients in the portable space. In the fixed broadband space, it was having around 21 million clients and in excess of 14 million in the broadcast area.
VOD Financial Performance
On 12th November 2019, the company made a press release to announce its interim results for the six months ended 30th September 2019. The company reported a marginal 0.4 per cent year on year growth in the group revenue to â¬21,939 million. The company also reported an operating profit of â¬577 million during H1 2019 as compared to an operating loss in the same period the previous year. The company also reported a major year on year decline in the loss for the period of â¬1891 million. The board proposed an interim dividend of ⬠4.50 Cents per share in the first half of the current period, a decline of 7 per cent compared to the interim dividend proposed in the same period of the previous year at ⬠4.84 Cents per share.
| Six months ended 30 September | |||
| 2019 | 2018 | Reported growth | |
| â¬m | â¬m | % | |
| Group revenue | 21,939 | 21,848 | +0.4 |
| Operating profit/(loss) | 577 | -2,029 | N/M |
| Loss for the financial period | -1,891 | -7,802 | N/M |
| Basic loss per share | (7.24 c) | (28.89 c) | N/M |
| Interim dividend per share | 4.50 c | 4.84 c | -7.00 |
Source: Company Website
VOD Stock Price Performance
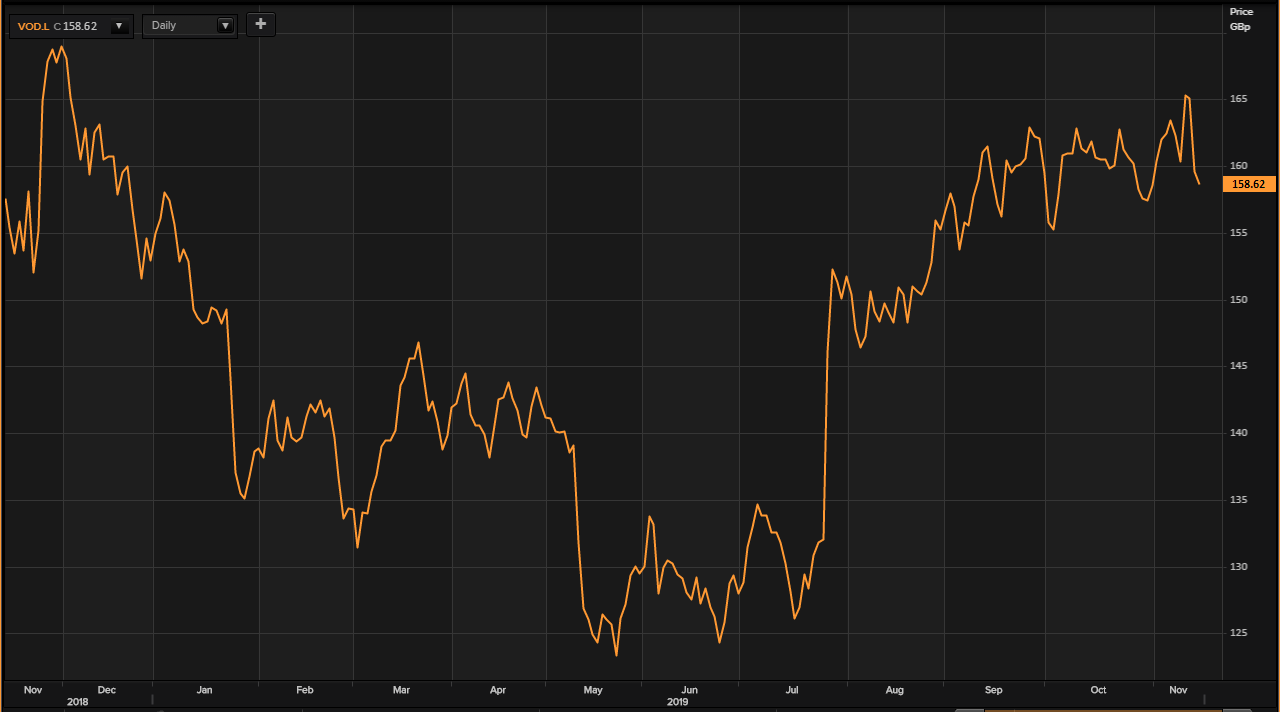
(Source: Thomson Reuters)
On 15th November 2019, at 08:23 A.M GMT, at the time of writing, Vodafone Group Plc âs stock price has been reported to be trading at GBX 158.62 per stock, a decrease of 0.60 per cent or GBX 0.96 per stock as compared to the previous dayâs closing price, which has been reported at GBX 159.58 per stock. At the time of writing, the Vodafone Group Plc stock price has been reported to be trading 29.78 per cent above the 52-week low stock price, which was at GBX 122.22 per stock, set on May 20, 2019. This was also 7.66 per cent below the 52-week high price at GBX 171.78 per stock, which the companyâs stock set on November 28, 2018. The reported Market Capitalisation of Vodafone Group Plc has been at GBP 42.717 billion.
At the time of writing, 1.56 million of the companyâs stocks had been traded in the market. The average volume of trading per day, for the last one year in the market, was 60.70 million stocks. The stock has reportedly shown an upward change of 2.07 per cent in value in the last one year, from the price of GBX 155.40 per stock. There also has been an upward change in the last six months in the value of Vodafone Group Plcâs stock of around 25.86 per cent from the stock price of GBX 126.02 per stock. Vodafone Group Plcâs stock has also reportedly lost 1.97 per cent in value in the last one month from the price of GBX 161.82 per stock.
The beta of the Vodafone Group Plcâs stock has been reported to be at 1.19. This means that the companyâs stock price movement is more volatile in its trend, as compared to the benchmark market indexâs movement.
