


After a two days fall, the British and European markets bounced back, and the sentiments were upbeat due to the following factors:
- Investors are focussing towards the Federal’s economic outlook later in the day.
- The OECD (Organisation for Economic Co-operation and Development) warned regarding the big hit to trade and jobs in the UK, due to delay in Brexit transition.
- The Bank of England is set to replenish the battered economic with another GBP 100 billion of bond buying next week.
- The house sales in England rebounded in the past month after the reopening of estate agents, pursuant to the government orders.
Considering the above market conditions, we will discuss about two financial service stocks - Standard Life Aberdeen PLC (LON:SLA) and a non-life insurance stock - RSA Insurance Group PLC (LON:RSA). As on 10th June 2020 (before the market close at 2.00 PM GMT+1), both the stocks (SLA and RSA) gained by 0.41 per cent and 2.60 per cent, respectively, against the previous day close. It is mindful to note that SLA announced a transaction in its own shares today. However, to better understand the price movements, we will go through their respective trading and operational updates.
Standard Life Aberdeen PLC (LON:SLA) – Controlling the Cost Base Amid the Economic Turbulence
Standard Life Aberdeen PLC is a FTSE 100 listed Investment Management Company. Its asset management business provides a range of products and services for institutional and individual clients. The Company is headquartered in Scotland, operates in more than 50 locations globally with around 6,000 employees. As at 31st December 2019, the Group reported GBP 544.6 billion of assets under administration and management. The Company distributes its net written premium into Household, Property, Motor, Liability, Other Personal Lines, Commercial Motor, and Marine & Other.
The Group is expected to release its half-yearly 2020 results on 7th August 2020.
(Source: Annual Report, Company Website)
Recent Significant Developments of 2020
10th June 2020: The Company announced the transaction in its own 909,115 shares. It was trading at weighted average price of 269.2307 per trading volume.
4th June 2020: The Company announced the disposal of 40,000,000 shares in HDFC Life at an average price of INR 496.40. The gross proceeds of the transaction will be used for general corporate purposes.
AGM 2020 Statement – Decline in AUMA, but have Decent Balance Sheet
On 12th May 2020, the Company held its 2020 Annual General Meeting, with the UK Government's social distancing guidelines. As at 30th April 2020, the Group reported GBP 490 billion in assets under management and administration with an estimated cash flow of GBP 24 billion in the first four months of 2020. Other Highlights are:
- However, the Group noted that excluding approximately GBP 25 billion withdrawals related to a Lloyds Banking Group mandate, and it saw net inflows of GBP 1 billion.
- The Group further strengthened its cash position by selling the stake of HDFC Life for GBP 237 million.
Financial Highlights – Decent Business Model, with Robust Capital Surplus and Returned Over £1bn to Shareholders
On 10th March 2020, the Group published its Annual Report and reported an increase in financial performance on a continuing basis for the financial year 2019. Additional Highlights are:
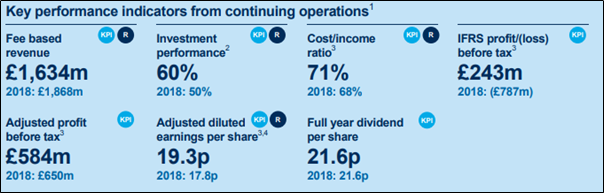
- Led by positive investment returns and an increase in profit on disposal of interests in associates, the group’s total income (continuing operations) increased to GBP 3,993 million for the financial year ending 31st December 2019 as against GBP 2,131 million in FY2018.
- The fee-based revenue stood at GBP 1,634 million in FY19 (FY18: £1,868 million). The investment performance over three years improved in 2019 to 60 per cent (2018: 50 per cent).
- However, the cost-income ratio increased to 71 per cent in FY19 as compared with the previous year (FY18: 68 per cent). The total dividend for 2019 stood at 21.6 pence.
Share Price Performance Analysis
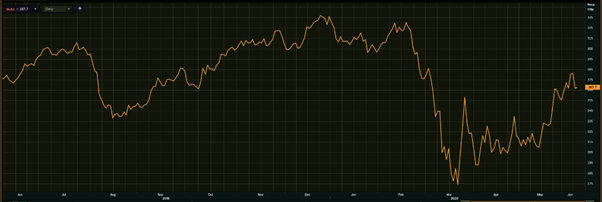
(Source: EODHD/Others, Thomson Reuters) -1-Year Chart as of June 10th, 2020, before the market close
SLA’s shares were quoting at GBX 267.70 on 10th June 2020 (before the market close at 2:40 PM GMT+1). Stock's 52 weeks High is GBX 338.25 and Low is GBX 170.30. Total outstanding M-Cap. (market capitalization) stood at approximately GBP 6.08 billion.
Business Outlook
The Company is targeting profitable revenue growth from Platforms and Wealth. The Group is accessing customers for future growth, with leveraging the strength of the brands; decent platform capability to attract client assets with advisors; strategic partnerships were improving distribution and access to markets, particularly to UK retail customers. The Group remained focused on capital generation and operational efficiency while improving the net fund flow. Further, the group is expected to sustain its decent market position.
RSA Insurance Group PLC (LON:RSA) – Performing Resiliently While Prudently Managing the Cash Flow.
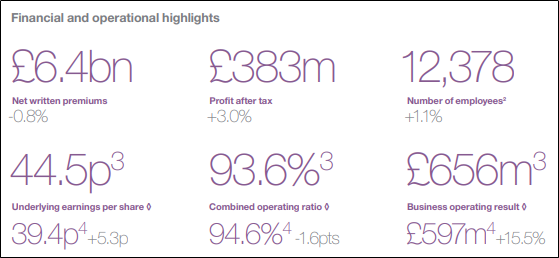
RSA Insurance Group PLC is a FTSE 100 General Insurance Company, which has been listed on the London Stock Exchange since 13th October 1993. It provides commercial and personal insurance products to its customer base globally. The Group caters to around 100 countries with an employee strength of around 13,500. The Company has a significant position in Canada, the United Kingdom, Scandinavia, Ireland, and the Middle East. In FY19, the Group reported a net written premium of GBP 6.4 billion.
On 30th July 2020, the Company is expected to release its half-yearly results.
(Source: Presentation, Company Website)
Synopsis of Recent Major Regulatory Updates
1st June 2020: As per statement regarding the Financial Conduct Authority’s business interruption court proceedings, the estimated cost of claims has not been materially changed.
7th May 2020: The Company affirmed in its annual general meeting that it had withdrawan the final dividend for FY19. The recommended final dividend for FY19 was 15.6 pence per share, which has been cancelled for the long term interest of all stakeholders; although, the Group has a strong capital base.
7th May 2020: The Company stated that despite the economic turmoil, the insurance is largely unchanged and the gross written premium was marginally declined in Q1 FY20 compared to Q1 FY19.
Q1 FY2020 Trading Update – Quarterly Momentum Due to All Regions
On 7th May 2020, the Group affirmed that the first-quarter results were solid, carrying the momentum witnessed in 2019. However, the Group is focusing on mitigating the disruption caused by COVID-19 and will reconsider dividends when it is rational. Also, the financial sector was heavily wedged by COVID-19 in March 2020. Some Additional Highlights are stated below:
- Excluding exits, RSA’s net written premiums declined by 1 per cent to GBP 1,521 million in the first quarter of 2020 against the same period last year. As per the region-wise, the Scandinavia and UK & International premiums reduced by 3 per cent and 5 per cent, excluding exits, while Canada premiums rose by 8 per cent to £303 million.
- Both excluding and including exit portfolios, the Group business operating profit for Q1 FY20 increased by double-digit percentages, with an enhanced combined ratio and a marginally lower investment income.
- On 31st March 2020, the tangible shareholders’ equity surged to GBP 3.15 billion (31 December 2019: £2.91 billion), driven by an augmented pension surplus, year to date profits, and FX movements. Whilst the tangible net asset value per share rose to 305 pence.
- The balance sheet unrealised gains tumbled GBP 167 million to GBP 204 million as at 31st March 2020.
- RSA’s estimated Solvency II coverage ratio was 151 per cent at 31 March 2020 (31st December 2019: 168 per cent), while the estimated ratio stood at 160 per cent, excluding this accrual.
Share Price Performance Analysis
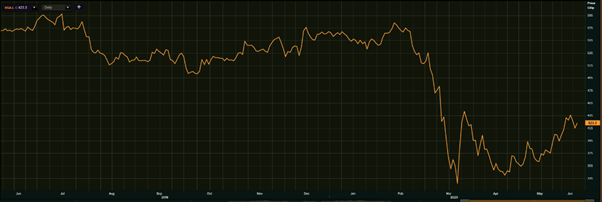
(Source: EODHD/Others, Thomson Reuters) -1-Year Chart as of June 10th, 2020, before the market close
RSA’s shares were quoting at GBX 423.30 on 10th June 2020 (before the market close at 2:36 PM GMT+1). Stock's 52 weeks High is GBX 736.84 and Low is GBX 321.20. Total outstanding M-Cap. (market capitalization) stood at approximately GBP 4.29 billion.
Business Outlook
RSA’s coverage ratio fell well within the target range of 130 per cent to 160 per cent. The Group is focusing on underwriting enhancement with healthy cost control which could sustain the business of the Group amid elevated global volatility. The Company expect the investment income to be lower in the current year. However, it is still within the range guided for the financial year 2020. Meanwhile, the Group is aiming towards building a balanced business in the UK and internationally, and the Board also suggested that it is too early to quantify the impact of Covid-19.
