
 AUS
AUS
 NZ
NZ
 UK
UK
 CA
CA
 USA
USA
 IND
IND







Big Yellow Group Plc
Big Yellow Group Plc is a United Kingdom domiciled Self Storage service providing company. The company owns a platform of 100 stores in the United Kingdom including that of its minority owned companies and has a total of 5.7 million square feet of area in its possession which is lettable and a further 0.9 million square feet of area under development. The company while choosing locations for its sites focuses on high profile, accessible and main road locations so as to derive maximum value for its clients.
The shares of the company have their listing on the main market segment of the London Stock Exchange. There they trade with the ticker name BYG. The shares of the company also form part of the FTSE 250 index.
Trading update
The company came out with its interim results on 19 November 2019 for the six-month period ended on 30 September 2019.
- The Like-for-like revenue of the company for the six-month period increased by 4.2 per cent driven by a growth in average occupancy and rates during the period.
- The Adjusted profit before tax of the company was up by 6.0 per cent for the six-month period to stand at £35.3 million.
- The cash flow from operating activities of the company for the six-month period increased by 4.0 per cent to stand at £36.0 million after the deduction of net finance costs.
- Average net rent per sq. feet increased by 1.6 per cent sequentially for the period.
Performance at the London Stock Exchange
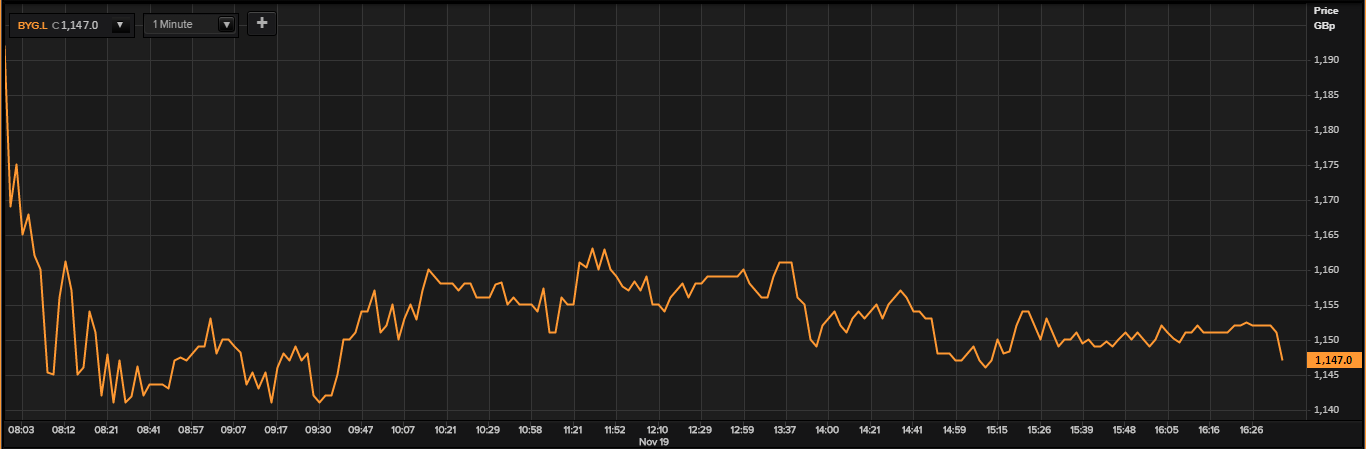
Price Chart as on 19 November 2019, after the market close (Source: Thomson Reuters)
On 19 November 2019, after the market close, BYG shares were quoted on the London Stock Exchange at GBX 1,147.00. Over a period of one year, the companyâs shares clocked 52-week High of GBX 1,194.00 and a 52-week low of GBX 846. The total market capitalization (M-Cap) of the group stood at around £1.92 billion.
Outlook
The company for the six-month period has been able to deliver a good set of numbers despite the uncertain economic headwinds prevailing in the United Kingdom.
Following the September 2018 placement of £65.3 million by the company, it has utilized the money to develop new stores and obtaining planning consents. The company expects these investments to start contributing to its bottom line from spring 2020 onwards.
CML Microsystems Plc
CML Microsystems Plc is a United Kingdom domiciled semiconductor chip designer and manufacturer targeting industrial storage and communication devices sectors. In its manufacturing process the company uses technologies that have been developed both in house and have been acquired from third party sources to deliver value to its clients with some part of the manufacturing process outsourced as well. The company operates in a niche segment with few market competitors with a market leading position in Europe, Far East and in the United States of America. The company also has strategic vendor relationships with some of the big industrial and communication equipment manufacturers of the world.
The shares of the company have their listing on the main market segment of the London Stock Exchange. There they trade with the ticker name CML.
Trading update
The company came out with its interim results on 19 November 2019 for the six-month period ending on 30 September 2019.
- The company for the six-month period earned group revenue of £13.06 million, whereas for the first half of 2019 the company earned a group revenue of £15.05 million.
- The gross profit earned by the company for the six-month period stood at £9.73 million, whereas for the first half of 2019 the companyâs gross profit was £10.72 million.
- The profit before tax earned by the company for the six-month period stood at £907,000, whereas for the first half of 2019 profit before tax of the company stood at £2.36 million.
- The adjusted EBITDA of the company for the six-month period stood at £4.36 million, whereas for the first half of 2019 the Adjusted EBITDA figure stood at £5.18 million.
- The Basic EPS of the company for the six-month period stood at 6 pence, while for the first half of 2019 the Basic EPS of the company stood at 12.65 pence.
Performance at the London Stock Exchange
Over a period of one year, the companyâs shares clocked 52-week High of GBX 462.00 and a 52-week low of GBX 260.00. The total market capitalization (M-Cap) of the group stood at around £52.77 million.
Outlook
The company has given a good performance despite a challenging business environment; the company may have underperformed in comparison to the corresponding prior-year period, but its performance has been similar to the immediately preceding interim period of six months.
The board for the half-year period has recommended a dividend of 2.0 pence per share while it had also made a recommendation of 2.0 pence per share for the first half of 2019 as well.
Â
Telecom Plus Plc
Telecom Plus Plc is a United Kingdom domiciled provider of competitively priced utility services spanning communications, energy and insurance markets.
The shares of the company have their listing on the main market segment of the London Stock Exchange. There they trade with the ticker name TEP. The shares of the company also form part of the FTSE 250 index.
Trading update
The company came out with its interim results on 19 November 2019 for the six-month period ending on 30 September 2019.
- The adjusted profit before tax of the company for the six-month period increased by £1.5 million to stand at £27.5 million, whereas for corresponding period in 2019 the adjusted profit before tax figure stood at £26.0 million.
- The revenues of the company for the six-month period stood at £353.2 million, whereas for corresponding six-month period in 2019 the figure stood at £310.8 million.
- The adjusted earnings per share of the company for the six-month period increased by 2.2 per cent to stand at 27.5 pence, whereas for corresponding previous period in 2019 adjusted earnings per share figure stood at 26.9 pence.
Performance at the London Stock Exchange
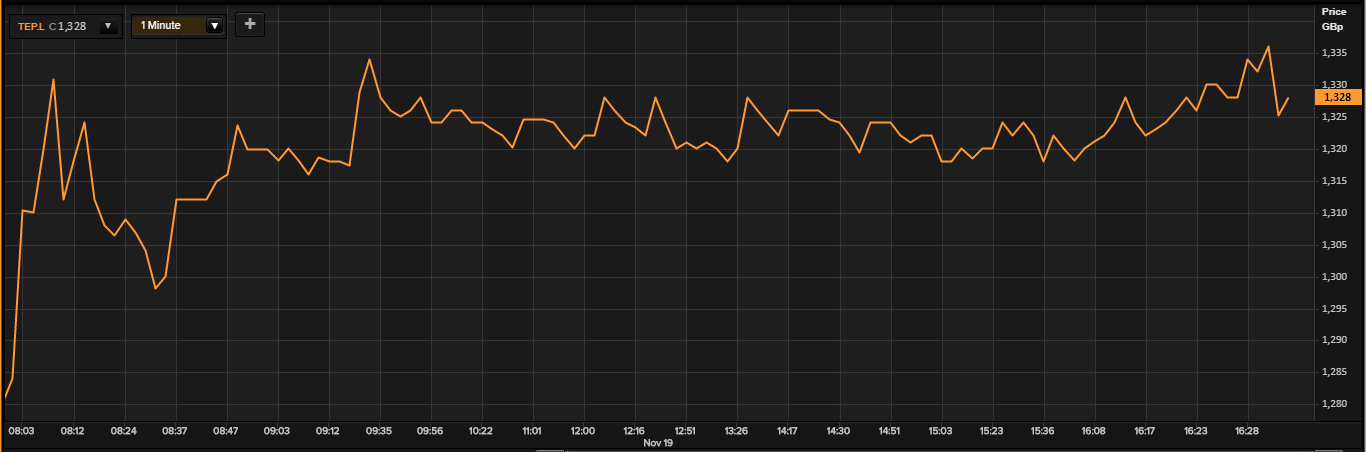
Price Chart as on 19 November 2019, after the market close (Source: Thomson Reuters)
On 19 November 2019, after the market close, TEP shares were quoted on the London Stock Exchange at GBX 1,328.00. Over a period of one year, the companyâs shares clocked 52-week High of GBX 1,542.00 and a 52-week low of GBX 1,094.00. The total market capitalization (M-Cap) of the group stood at around £1.04 billion.
Outlook
The performance of the company for the six-month period has been sterling. The company has a competitive position among suppliers of energy in United Kingdom. The company remains hopeful of repeating this performance in the second half of the financial year as well.
