


Great Portland Estates Plc
Great Portland Estates PLC (GPOR) is a London-headquartered Real Estate Investment Trust, focused on development and property investment in central London, with a West End focus. The portfolio of the group includes refurbished spaces, and historic buildings for retail, commercial and residential use and purpose-built new developments, with the company owning £2.6 billion of real estate in central London spread across around 47 properties in over 35 sites with a total area of around 2.6 million square feet.
GPOR-Financial highlights for H1 FY20
(Source: LSE)
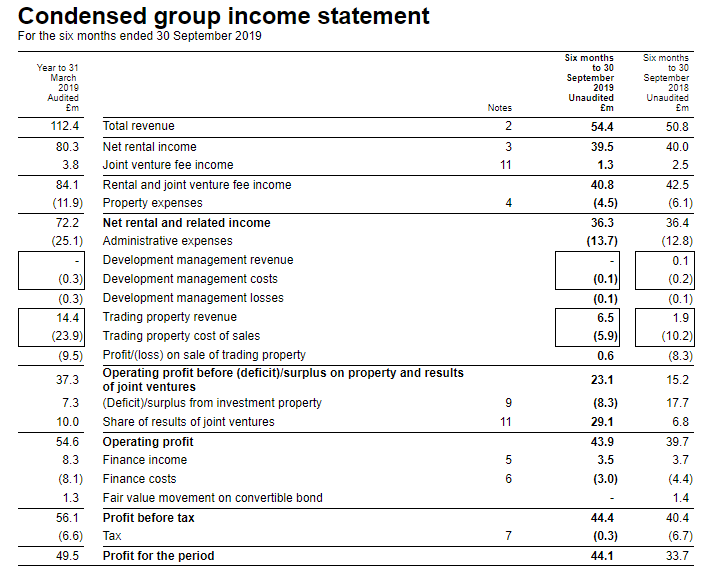
On 14th November 2019, the company released interim results for a six months period ended 30th September 2019 for the fiscal year 2020. The companyâs revenue increased to £54.4 million in H1 FY20 from £50.8 million in H1 FY19. The companyâs net rental and related income were recorded at £36.3 million in H1 FY20, which remained almost flat as compared to the same period previous year data. The companyâs operating profit was recorded at £43.9 million in H1 FY20 as against £39.7 million in H1 FY19. The companyâs profit before taxation increased to £44.4 million in H1 FY20 from £40.4 million in H1 FY19. The companyâs profit for the period increased to £44.1 million in H1 FY20 from £33.7 million in H1 FY19. The company declared an interim dividend of 4.7 pence per share for the period.
GPOR-Share price performance
Daily Chart as at 14-November-19, before the market closed (Source: Thomson Reuters)
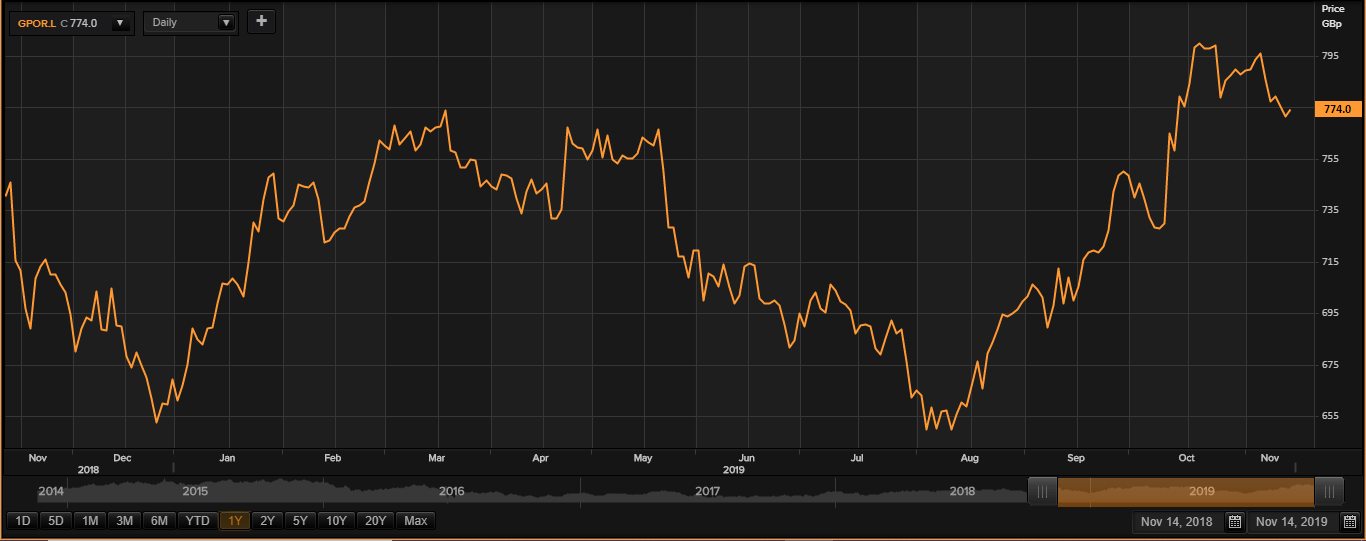
On 14th November 2019, while writing at 11:04 AM GMT, Great Portland Estates Plc shares were clocking a current market price of GBX 774.00 per share; which was up by 0.38 per cent in comparison to the last traded price of the previous day. The companyâs market capitalisation was at £1.96 billion at the time of writing.
On 22nd October 2019, the shares of GPOR have touched a new peak of GBX 812.00 and reached the lowest price level of GBX 643.80 on 13th August 2019 in the last 52 weeks. The companyâs shares were trading at 4.67 per cent lower from the 52-week high price mark and 20.22 per cent higher than the 52-week low price mark at the current trading level as can be seen in the price chart.
The stockâs traded volume was hovering around 459,750 at the time of writing before the market close. The companyâs 5-day stock's daily average traded volume was 1,253,927.00; 30 days daily average traded volume- 1,180,543.83- and 90-days daily average traded volume â 1,023,634.40. The volatility of the companyâs stock was 48 per cent lower as compared with the index taken as the benchmark, as the beta of the companyâs stock was recorded at 0.52.
The shares of the company have delivered a positive return of 17.67 per cent in the last quarter. The companyâs stock surged by 16.98 per cent from the start of the year to till date. The companyâs stock has given investors 4.19 per cent of a positive return in the last year.Â
Norcros Plc
Norcros Plc (NXR) is into commercialisation and manufacturing of home consumer goods in the United Kingdom and also in South Africa. The company has a strong presence in the United Kingdom and South Africa. The company has a diverse range of products on showers, taps, bathroom accessories, tiles and adhesives.
NXR-Financial highlights for H1 FY20
(Source: LSE)
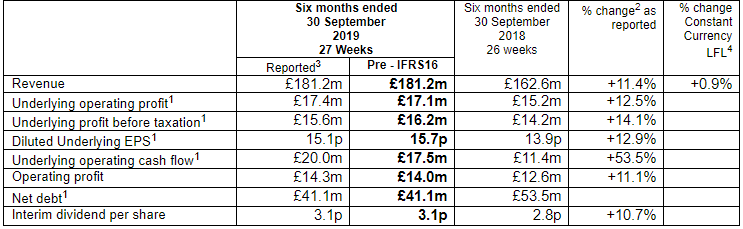
On 14th November 2019, the company released interim results for six months period ended 30th September 2019 for the fiscal year 2020. The companyâs revenue (reported) was up by 11.4 per cent to £181.2 million in H1 FY20 as against £162.6 million in H1 FY19.  The companyâs underlying operating profit (reported) was up by 12.5 per cent to £17.4 million in H1 FY20 as against £15.2 million in H1 FY19. The companyâs underlying profit before taxation (reported) was up by 14.1 per cent to £15.6 million in H1 FY20 as against £14.2 million in H1 FY19. The companyâs diluted underlying EPS (reported) was up by 12.9 per cent to 15.1 pence in H1 FY20 as against 13.9 pence in H1 FY19. The companyâs operating profit (reported) was up by 11.1 per cent to £14.3 million in H1 FY20 as against £12.6 million in H1 FY19. The company declared an interim dividend of 3.1 pence per share in H1 FY20 as against 2.8 pence per share in H1 FY19.
NXR-Share price performance
Daily Chart as at 14-November-19, before the market closed (Source: Thomson Reuters)
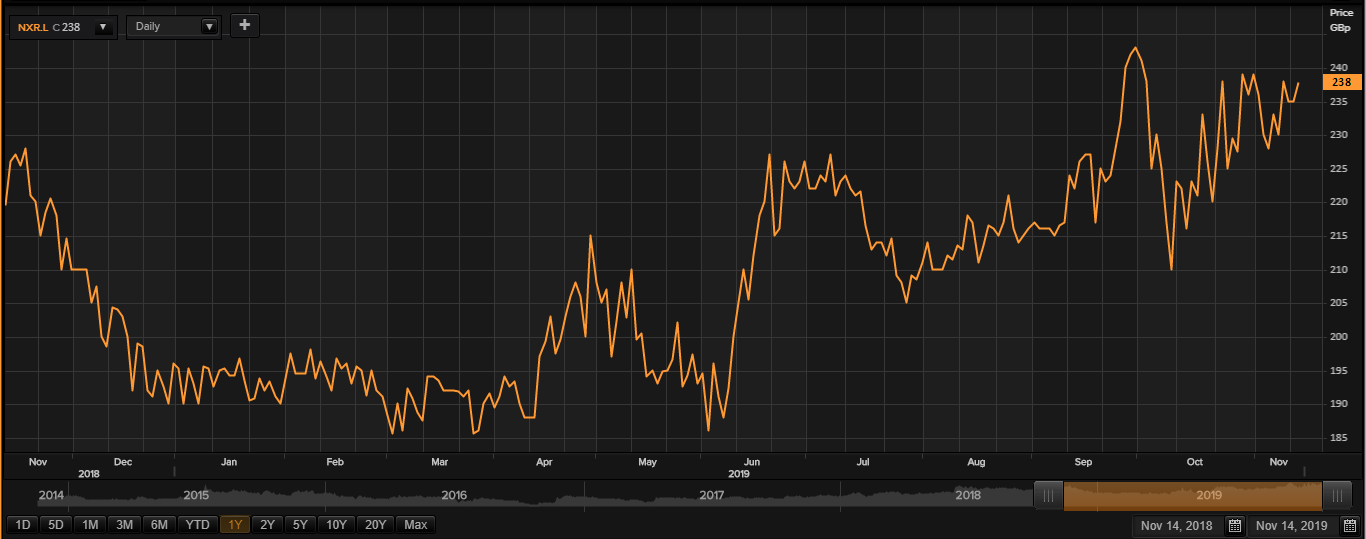
On 14th November 2019, while writing at 11:08 PM GMT, Norcros PLC shares were clocking a current market price of GBX 238.00 per share; which was more by 1.27 per cent in comparison to the last traded price of the previous day. The companyâs market capitalisation was at £189.02 million at the time of writing.
On 3rd October 2019, the shares of NXR have touched a new peak of GBX 245.00 and reached the lowest price level of GBX 181.90 on 18th December 2018 in the last 52 weeks. The companyâs shares were trading at 2.85 per cent lower from the 52-week high price mark and 30.84 per cent higher than the 52-week low price mark at the current trading level as can be seen in the price chart.
The stockâs traded volume was hovering around 6,847 at the time of writing before the market close. The companyâs 5-day stock's daily average traded volume was 27,681.20; 30 days daily average traded volume- 50,562.73 - and 90-days daily average traded volume â 84,342.82. The dividend yield of the stock was 3.57 per cent at the time of writing.
The shares of the company have delivered a positive return of 10.33 per cent in the last quarter. The companyâs stock surged by 23.68 per cent from the start of the year to till date. The companyâs stock has given investors 7.06 per cent of a positive return in the last year.Â
Tracsis Plc
Tracsis Plc (TRCS) provides software solutions, hardware solutions and services for the rail, traffic data and wider transport industries and is a leader in the industry. The forte of the company lies in providing data capturing solutions along with customised associated professional services.
TRCS-Financial highlights for FY19
(Source: LSE)
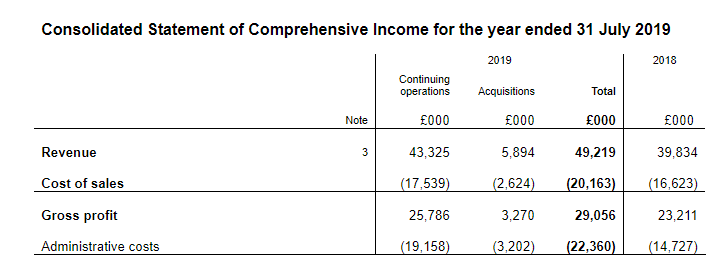
On 14th November 2019, the company released audited results for the fiscal year 2019 period ended 31st July 2019. The companyâs revenue surged by 24 per cent to £49.2 million in FY19 as against £39.8 million in FY18. The companyâs adjusted EBITDA surged by 12 per cent to £10.5 million in FY19 as against £9.4 million in FY18. The companyâs operating profit after excluding exceptional items surged by 13 per cent to £6.7 million in FY19 as against £5.9 million in FY18. The company had cash balances of £24.1 million by the end of the period. The company paid an interim dividend of 0.8 pence per share in April 2019.
TRCS-Share price performance
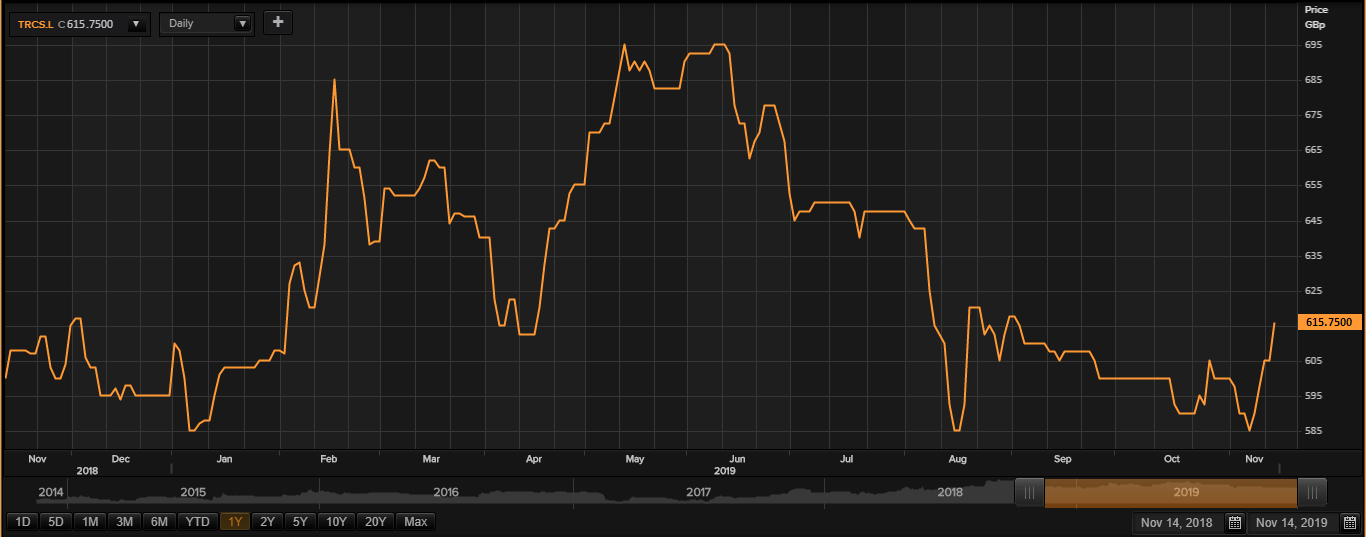
Daily Chart as at 14-November-19, before the market closed (Source: Thomson Reuters)
On 14th November 2019, while writing at 11:12 AM GMT, Tracsis Plc shares were clocking a current market price of GBX 615.75 per share; which was more by 1.77 per cent in comparison to the last traded price of the previous day. The companyâs market capitalisation was at £174.14 million at the time of writing.
On 10th June 2019, the shares of TRCS have touched a new peak of GBX 705.00 and reached the lowest price level of GBX 580.00 on 16th August 2019 in the last 52 weeks. The companyâs shares were trading at 12.65 per cent lower from the 52-week high price mark and 6.16 per cent higher than the 52-week low price mark at the current trading level as can be seen in the price chart.
The stockâs traded volume was hovering around 38,124 at the time of writing before the market close. The companyâs 5-day stock's daily average traded volume was 16,863.40; 30 days daily average traded volume- 42,425.50 - and 90-days daily average traded volume â 40,750.16. The volatility of the companyâs stock was lower as compared with the index taken as the benchmark, as the beta of the companyâs stock was recorded at 0.14 with a dividend yield of 0.28 per cent.
The shares of the company have delivered a negative return of 0.82 per cent in the last quarter. The companyâs stock surged by 1.68 per cent from start of the year to till date. The companyâs stock has given investors 0.83 per cent of a positive return in the last year.Â
