


_07_03_2026_03_50_21_133108.jpg)

dotDigital Group PLC
United Kingdom-based dotdigital Group plc (DOTD) is a leading provider of software solutions enabling email marketing to empower digital marketeers. The company has an automated marketing platform with superior tools & services, which is used by more than 70,000 marketing professionals in 150 plus countries across the globe.
DOTD-Financial highlights for FY19
On 15th October 2019, the company released its annual results for the fiscal year 2019 period ended 30th June 2019. The companyâs revenue was up by 19 per cent to £51.3 million in FY19 as against £43.1 million in FY18. The companyâs organic revenue was up by 15 per cent to £42.5 million in FY19 as against £36.9 million in FY18. The companyâs EBITDA (adjusted) from continuing operations surged by 24 per cent to £14.7 million in FY19 as against £11.8 million in FY18. The companyâs operating profit (adjusted) from continuing operations surged by 25 per cent to £11.8 million in FY19 as against £9.4 million in FY18. The companyâs earnings per share (adjusted) surged by 33 per cent to 3.88 pence in FY19 as against 2.91 pence in FY18. The company had cash balances of £19.3 million by the end of the fiscal year 2019 as against £15.0 million in FY18. The company made good progress in marketing integrated channels for cross-selling. The company saw continuous investment in machine learning and artificial intelligence systems. The companyâs strategic partnership with Magneto led to a surge of 27 per cent in revenue amounting to £11.8 million in FY19 as against £9.3 million in FY18. The company has made consistent efforts in strengthening relationships with BigCommerce and Shopify as an elite partner. The company made investments with Microsoft Dynamics, which led to 10 per cent revenue growth amounting to £3.9 million. The company has managed to carry forward its momentum into the new fiscal year with recurring revenues and remains confident for the fiscal year 2020.
DOTD-Share price performance
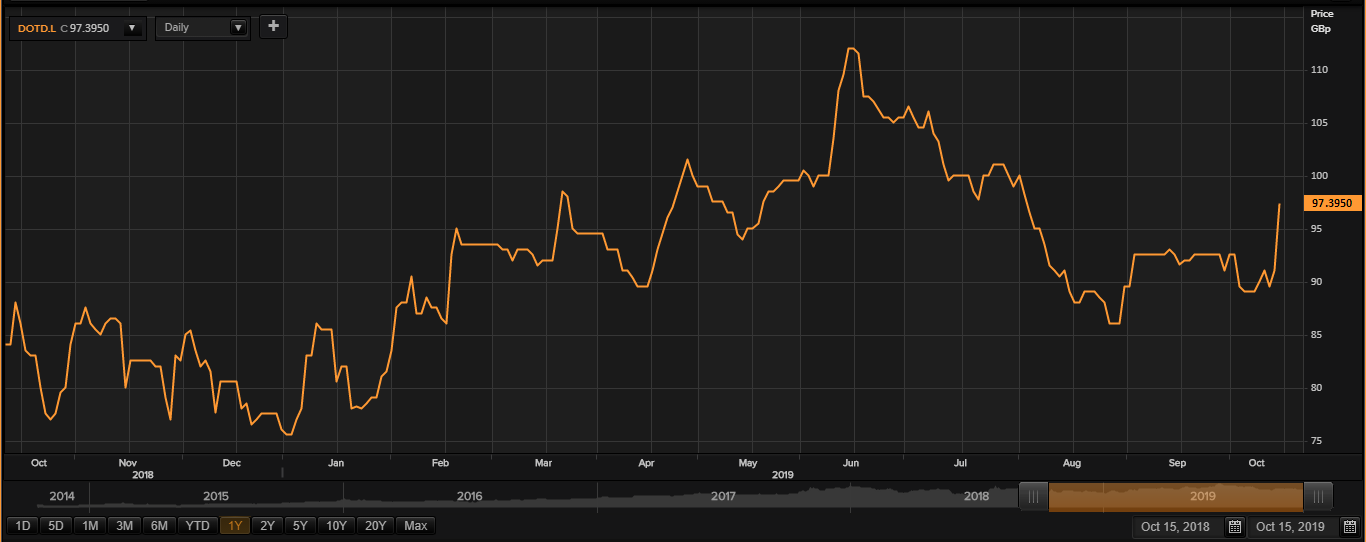
On 15th October 2019, at the time of writing the report (at 11:55 am GMT, before the market close), dotdigital Group plc shares were trading at GBX 97.39, up by 7.02 per cent against the previous day closing price. Stock's 52 weeks High and Low is GBX 114.00/GBX 70.10. The companyâs stock beta was 1.15, reflecting more volatility as compared to the benchmark index. The outstanding market capitalisation was around £271.49 million, with a dividend yield of 0.70 per cent.
Schroders PLC
Schroders PLC (SDR) is a British-based asset manager, headquartered in London, the United Kingdom. The company operates asset management business from 29 countries across Europe, the Americas, Asia & Australia and the Middle East and provides advisory and consultancy services to financial institutions, high net worth clients, large corporate, and other institutions.
SDR-Q3 FY19 update
On 15th October 2019, the company released third-quarter update for the period ended 30th September 2019. The companyâs assets under management were recorded at £450.8 billion as on 30th September 2019.
SDR-Financial highlights for H1 FY19
In H1 FY19, the companyâs reported net income decreased by 5 per cent to £1,032.6 million as compared with the corresponding period of the last year. The companyâs operating costs remained flat for the period as compared to H1 FY18. Profit before tax and exceptional items was £340.4 million, a decrease of 14 per cent against the £397.1 million recorded in H1 FY18. Reported profit before tax reduced by 14 per cent to £319.3 million against the same period in 2018. The companyâs Basic earnings per share excluding exceptional items plunged to 98.6 pence in H1 FY19 as against 114 pence in H1 FY18. Basic earnings per share stood at 92.4 pence, a decrease from the previous year same period data.
The companyâs Board had declared an interim dividend per share of 35 pence which remained flat against the same period in 2018.
The companyâs assets under management (AUM) rose by 9 per cent to £444.4 billion against the £407.2 billion at 31st December 2018. Net outflows were £1.2 billion against the net inflows of £1.2 billion in H1 FY18. On 30th June 2019, total equity stood at £3.6 billion.
SDR-Share price performance
Â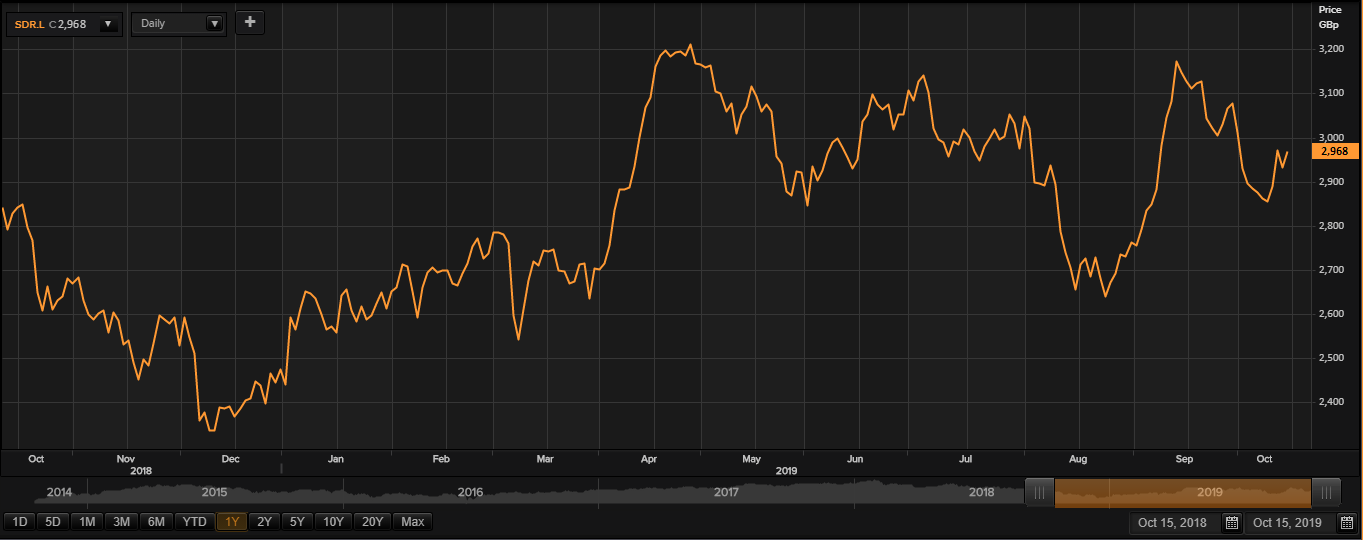
On 15th October 2019, at the time of writing the report (at 11:59 am GMT, before the market close), Schroders PLCâs shares were trading at GBX 2,968, up by 1.29 per cent against the previous day closing price. Stock's 52 weeks High and Low is GBX 3,226.00/GBX 2,289.00. The companyâs stock beta was 1.35, reflecting more volatility as compared to the benchmark index. The outstanding market capitalisation was around £7.92 billion, with a dividend yield of 3.89 per cent.
Marston's PLC
United Kingdom-headquartered Marstonâs PLC (MARS) is into the business of beer brewing and running pubs. The company is a leader in brewing premium cask and bottled beers. The company manages several traditional and contemporary breweries along with family pub restaurants, fashionable town centre bars and 40 inns across the country. The company supplies beer to estates, pubs and other supermarkets. The company looks forward to announcing its preliminary results by 27th November 2019.
MARS-Trading update for FY19
On 15th October 2019, the company released year-end trading update for the period ended 28th September 2019. The companyâs revenue was up by 3 per cent to £1.2 billion. The company expects reported EBITDA to remain flat this year as compared to the previous year and profit before taxation (underlying) to be around £101 million. The companyâs total pub sales surged by 3 per cent, inclusive of 0.8 per cent sales growth (like-for-like basis). The companyâs net debt was recorded at £1,399 million by the end of the year as expected by the management. Furthermore, the company looks forward to reducing £200 million of debt by 2023.
MARS-Financial Highlights for H1 2019
Reflecting the benefits of new-build pub-restaurants and bars and like-for-like sales growth of 1.2%, the revenue of Destination and Premium increased by 2.4% to £215.7 million. Due to an increase of 3.9% in managed and franchised like-for-like sales, revenue from Taverns increased by 4.0% to £154.2 million, while the continued growth in own-brewed and licensed volumes helped to post revenue increase of 8.3% to £183.2 million in Brewing. Its beer business achieved 4.4% growth in own-brewed and licensed volumes, while total managed and franchised like-for-like sales grew by 2.2%, driving underlying revenue to increase by 4.7% to £553.1 million. Underlying operating profit of £76.1 million (H1 2018: £74.3 million) was up 2.4% and group underlying operating margins were 0.3% behind last year, while total operating profit was £66 million, down from £133.4 million reported in the last year. Reflecting growth in each of its trading segments offset by higher finance costs, underlying profit before tax was up 1.9% to £37.0 million (H1 2018: £36.3 million), while total profit before tax declined to £19.1 million from £54.3 million reported in the prior year, reflecting the non-recurrence of the non-cash accounting adjustments relating to the estate valuation. Basic underlying earnings per share was were up 2.1% on last year to 4.9 pence per share (H1 2018: 4.8 pence per share) and basic earnings per share were 2.6 pence per share (H1 2018: 2.0 pence loss per share). With the ratio of net debt to underlying EBITDA of 4.8 times at the period end (H1 2018: 4.8 times on pro-forma basis), net debt excluding lease financing was £1,082 million and net debt at the period end was £1,438 million. Reflecting the guidance provided in the January 2019 Trading Update, the company declared an interim dividend at 2.7 pence per share.
MARS-Share price performance
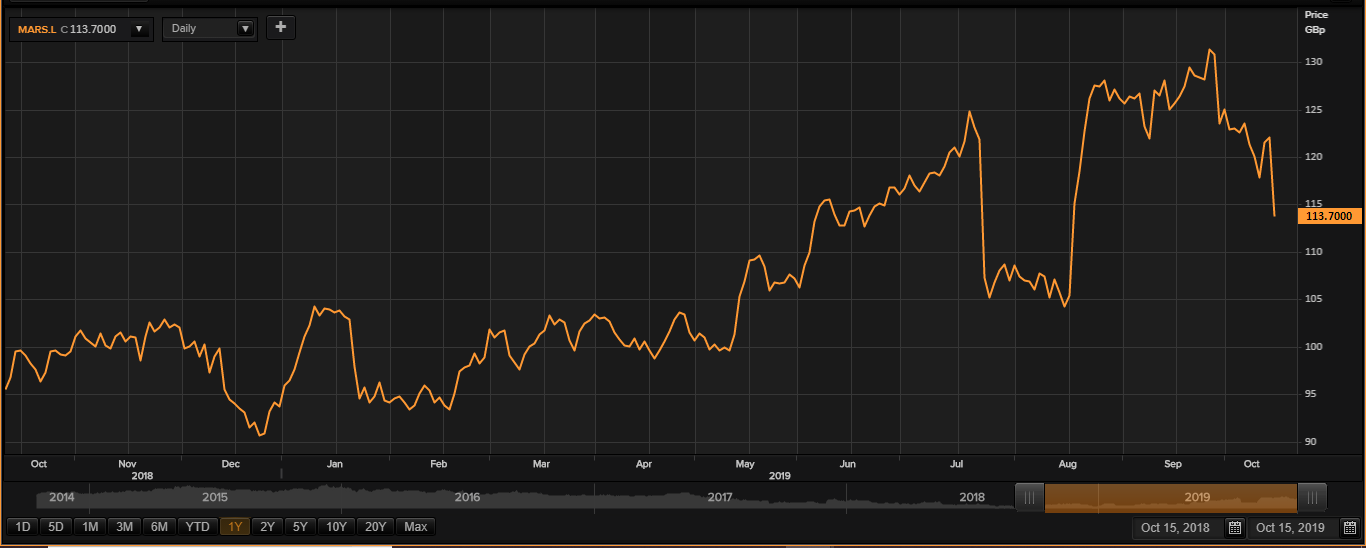
On 15th October 2019, at the time of writing the report (at 11:57 am GMT, before the market close), Marstonâs PLC shares were trading at GBX 113.70, down by 6.80 per cent against the previous day closing price. Stock's 52 weeks High and Low is GBX 131.70/GBX 89.70. The companyâs stock beta was 0.19, reflecting less volatility as compared to the benchmark index. The outstanding market capitalisation was around £776.02 million, with a dividend yield of 6.15 per cent.
