


Global economy witnessed large ups and downs in 2019, ranging from US-China trade tension, turmoil in oil prices, demand slowdown to still lingering Brexit. However, many mainstream forecasters expect that worst is behind, and global growth is all set to rebound in 2020.
With a preliminary phase -1 trade deal being negotiated between the US and China that committing a cease-fire between the world's two largest economies. However, a final phase-1 trade deal hasn't been reached yet between the US and China.
Also, after Tories got a thumping majority in the December 12, general election, Britain in all probability would formally leave European Union at the end of January 2020. However, there is yet a lack of clarity over comprehensive trade agreement between the United Kingdom and European Union, which the British Prime Minister had vowed to get done by the end of 2020, and which is almost impossible to achieve as per EU officials.
In this piece of article, we are going to discuss some of the best and worst FTSE stock charts of 2019
Best Performers of 2019
Luceco Plc (LON:LUCE)
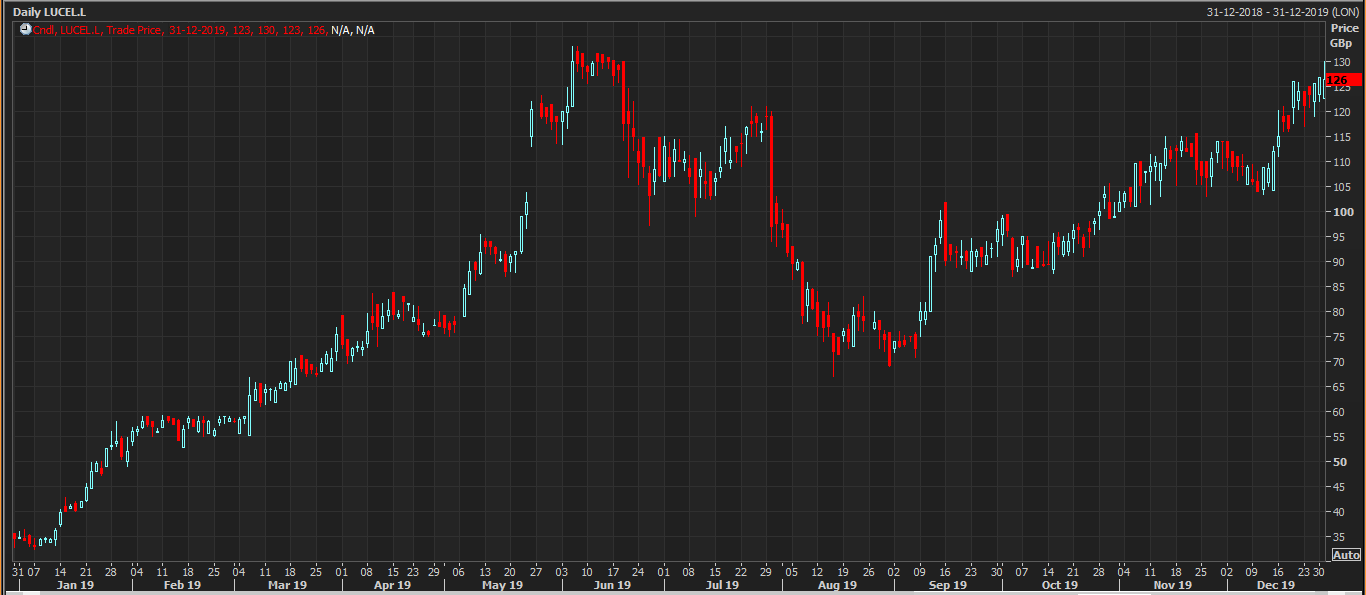
Daily price chart as on December 31, 2019 (after the market close). Source: Thomson Reuters
London Stock Exchange-traded Luceco Plc is an Electronics & Electrical Equipment company. The company offers a range of brands which include Ross, Luceco, Masterplug and BG Electrical. The outstanding market capitalisation of the group stood at £203.25m, which ranks it among the small caps listed and traded on the LSE.
On a YoY basis, shares of LUCE have delivered a massive price return of 266.4% and emerged as the topmost performers among the FTSE stocks listed and traded on the LSE. In the past three months, its stocks have handed more than 30% return and were up by more than 10% in the month over period as well. Also, its shares ended 2019, well above its all short-term and long-term moving averages of 5-day, 10-day, 20-day, 50-day, 100-day and 200-day SMAs, which is typically considered as a favourable technical trend in the stock.
Future Plc (LON:FUTR)
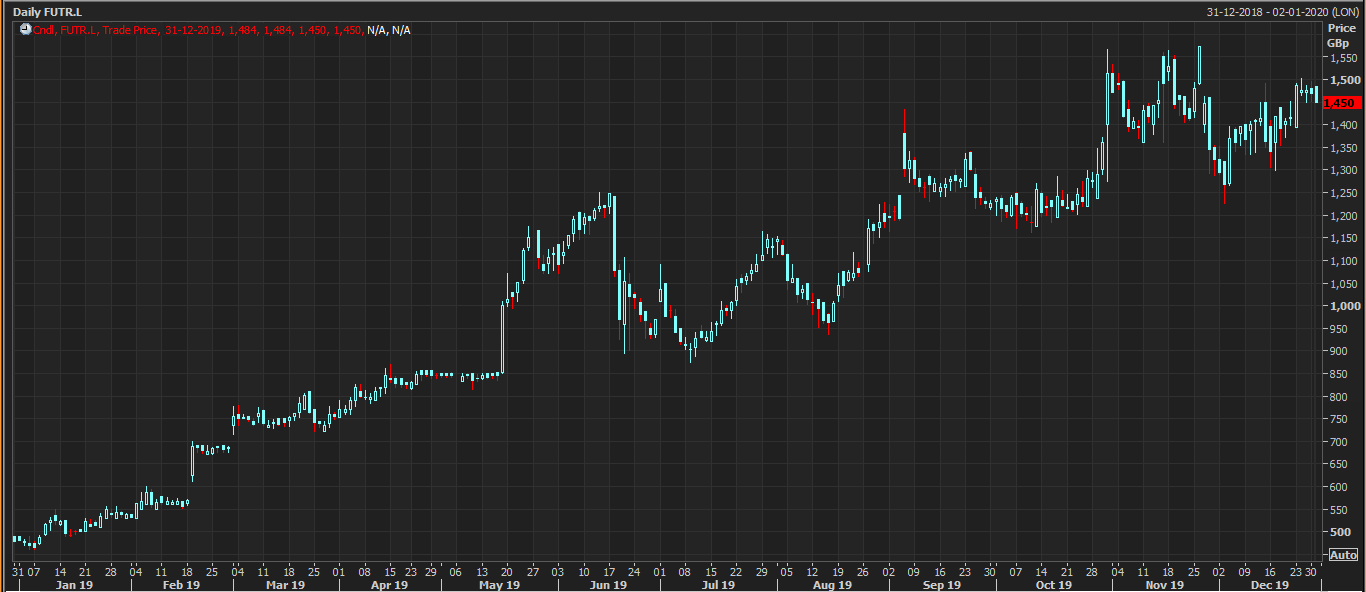
Daily price chart as on December 31, 2019 (after the market close). Source: Thomson Reuters
Future Plc is the United Kingdom-based media company. The group's operational interests lie in the publishing of special-interest consumer magazines, applications and websites. The outstanding market capitalisation of the company stood at £1.42bn, which ranks its among the mid-caps listed and traded on the LSE. The stock is also a constituent of the FTSE 250 index.
On a YoY basis, shares of FUTR have delivered a price return of 203.35% and emerged as the second-best FTSE performers among the stocks listed and traded on the LSE. Also, the stocks were up by approximately 18% in the past three months and handed gains of over 9% in the month-over period.
The stock has ended 2019, approximately 30% above its long-term support level of the 200-day simple moving average, a favourable long-term technical trend.
Pets at Home Group Plc (LON:PETS)
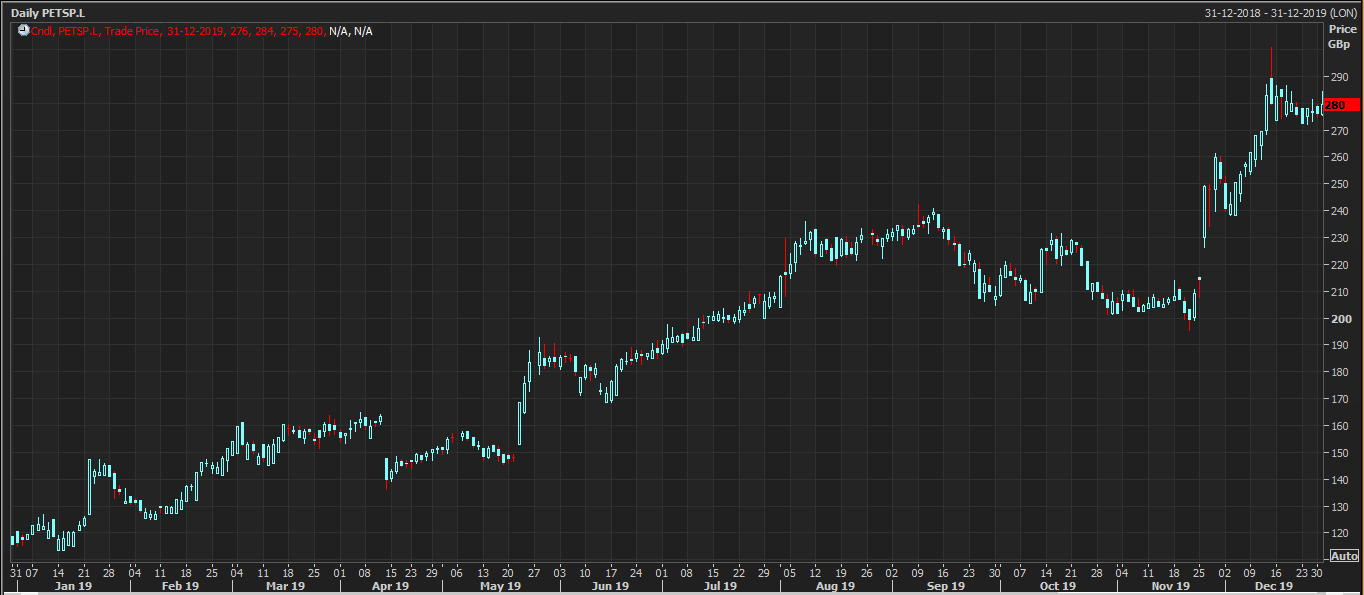
Daily price chart as on December 31, 2019 (after the market close). Source: Thomson Reuters
Pets at Home Group Plc is UK-based general retailer. It is engaged in retailing of pet food, pet products and pet-related services. It also offers pet grooming salons. The outstanding market capitalisation of the company stood at £1.40bn, which ranks it among the mid-caps listed and traded on the London Stock Exchange. It is a constituent company of the FTSE 250 index as well.
In a year-over period, shares of PET delivered an unexpected return of 141% and stood at the third-best FTSE performer at the London Stock Exchange. In the past three months, its shares gave more than 34% return and were up by around 10.95% in the month-over period.
Also, from the technical standpoint, its shares ended 2019 way above its crucial long-term and short-term support level of 50-day, 100-day and 200-day simple moving averages.
JD Sports Fashion Plc (LON:JD)
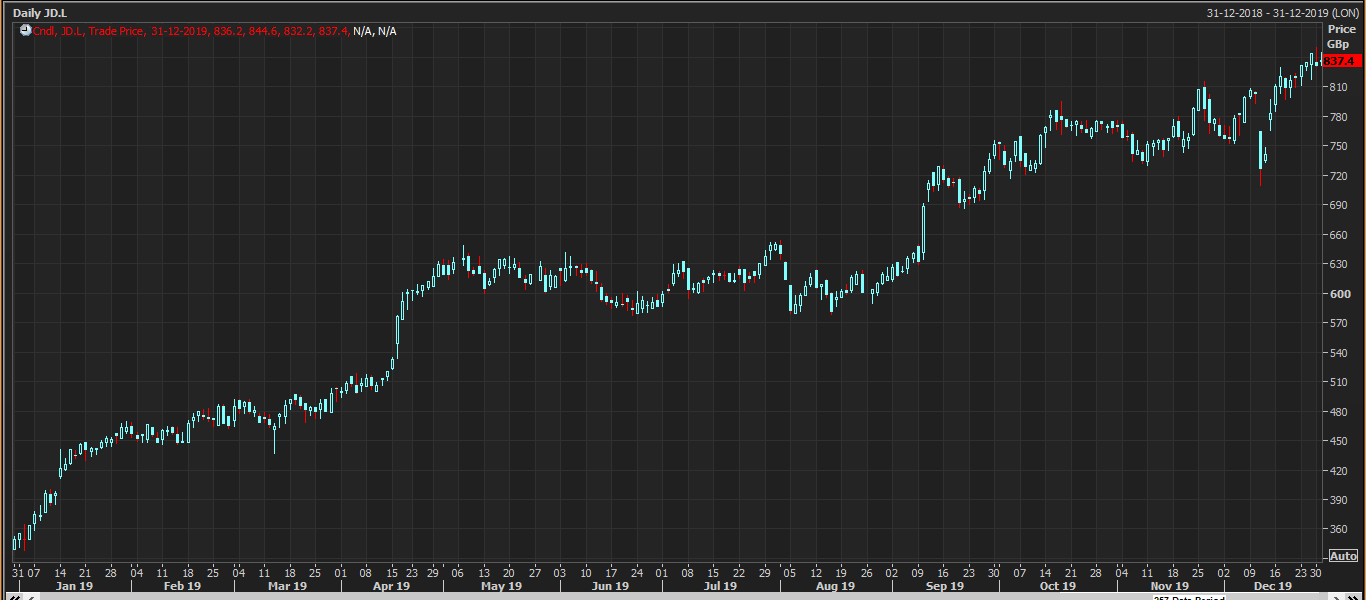
Daily price chart as on December 31, 2019 (after the market close). Source: Thomson Reuters.
UK-headquartered JD Sports Fashion Plc is a multi-channel retailer of sports fashion and outdoor brands. Its areas of operations are divided into two segments which are Sports and Outdoor. The outstanding market capitalisation of the company stood at £8.15bn, which ranks it among the large caps listed and traded on the LSE and it is a constituent company of the FTSE 100 index as well.
In the year-over period, shares of JD have delivered a price return of 140.1% and were up by 35% in the past three-month time and surged approximately 11% in the month-over period.
It ended 2019 significantly above its crucial long-term and short-term support levels of 200-day and 100-day simple moving averages.
Dunelm Group Plc (LON:DNLM)
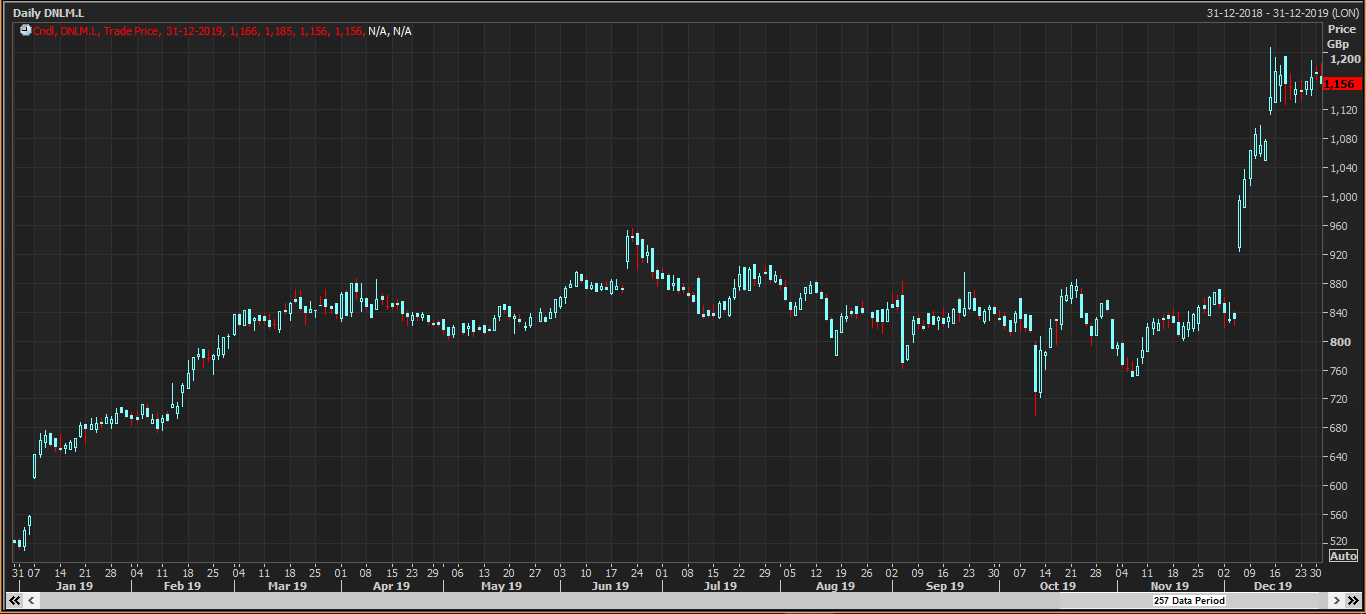
Daily price chart as on December 31, 2019 (after the market close). Source: Thomson Reuters.
London Stock Exchange-traded Dunelm Group Plc is the United Kingdom-based general retailer company with operational interest in the homewares market. The outstanding market capitalisation of the group stood at £2.3bn, which ranks it among the mid-caps listed and traded on London Stock Exchange.
On a YoY basis, its shares surged by nearly 122%, were up by around 38% in the past three months and gained more than 35% in the month-over period. Also, it ended 2019 significantly above its crucial long-term as well as short-term support levels of 200-day, 100-day and 50-day SMAs, a favourable technical trend.
Worst Performers of 2019
Metro Bank Plc (LON:MTRO)
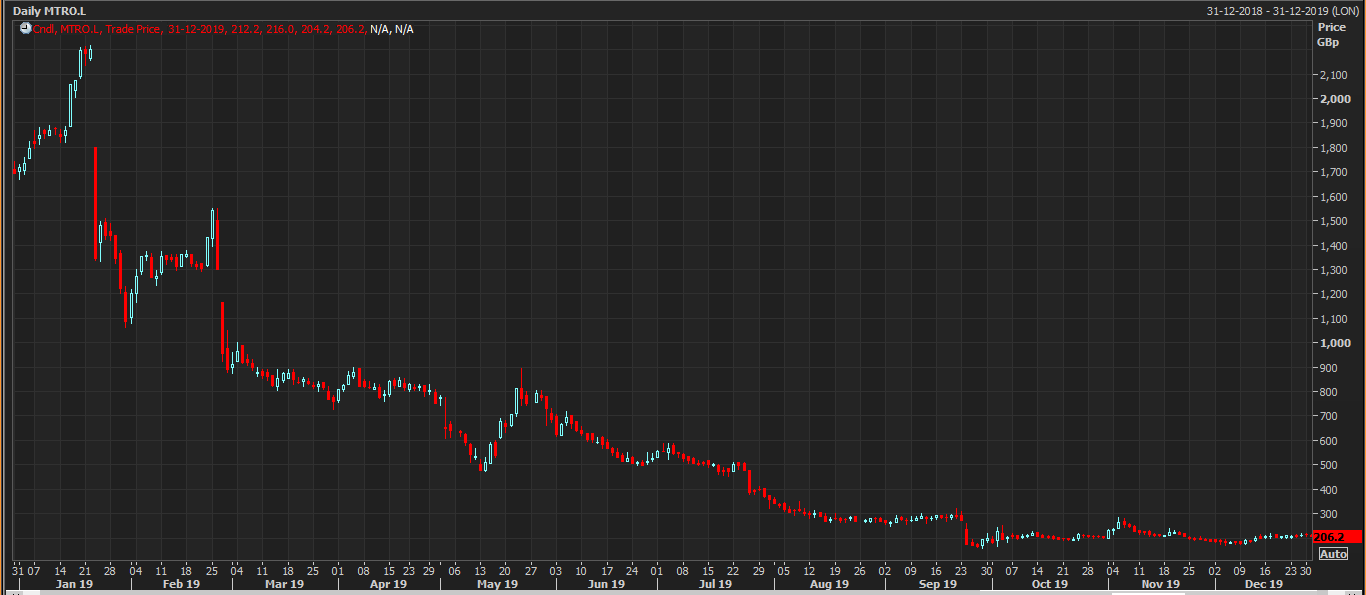
Daily price chart as on December 31, 2019 (after the market close). Source: Thomson Reuters.
UK-headquartered Metro Bank Plc is engaged in providing banking services with principal activities, including the provisions of banking and related services. The group caters its services to retail, small and medium-size commercial customers. The outstanding market capitalisation of the group stood at £355.5m, which ranks it among the small caps listed and traded on the London Stock Exchange.
On a YoY basis, shares of MTRO plunged approximately 88%, and turned out to be among the top FTSE laggard stocks listed and traded on the London Stock Exchange. Also, its shares ended 2019 significantly below its crucial long-term as well as short-term support level of 200-day, and 50-day moving Averages, an unfavourable technical trend.
Kier Group Plc (LON:KIE)
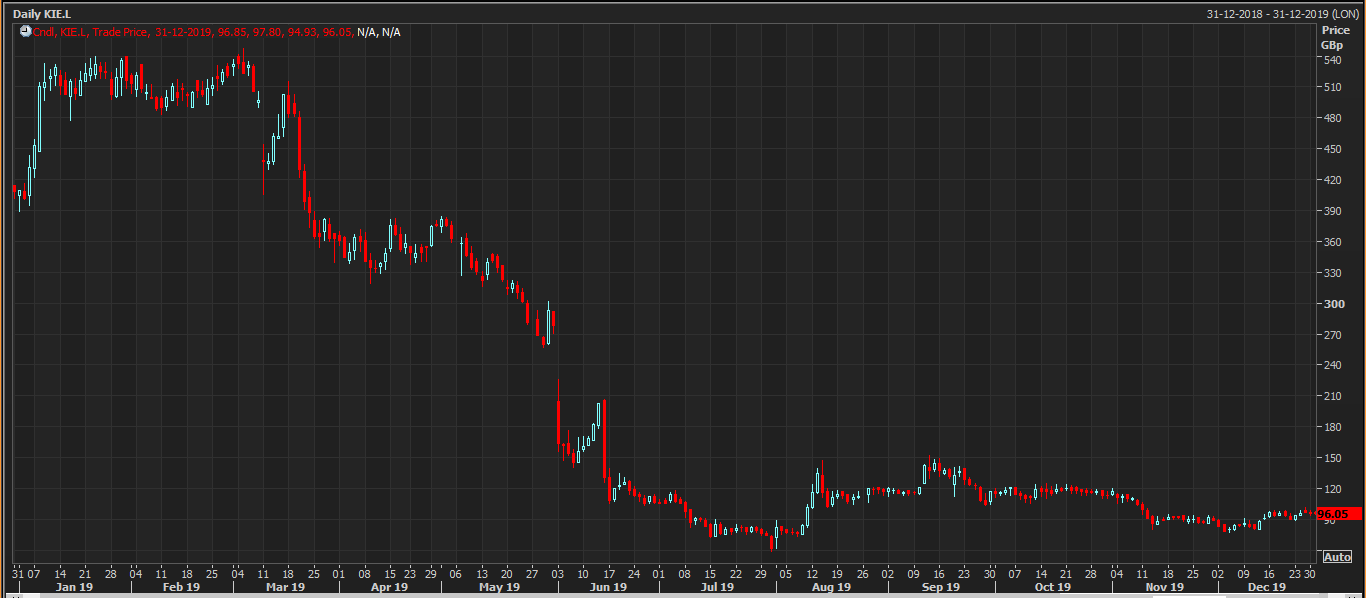
Daily price chart as on December 31, 2019 (after the market close). Source: Thomson Reuters.
London Stock Exchange-traded Kier Group Plc is the UK-based construction and materials company. Its operational segments are divided into four categories which are property, residential, construction and services. The outstanding market capitalisation of the company stood at £155.71m, which ranks it among the small-cap listed and traded on the London Stock Exchange.
On a YoY basis, its stocks nosedived and reported YoY price plunge of approximately 77%, were down approximately 18% in the past one-month time, however, they have garnered gain of around 8% in the month-over period and 7% in the past five trading sessions.
Its shares ended 2019 significantly below its short-term and long-term support levels of 50-day, 100-day and 200-day simple moving averages, which is typically perceived to be an unfavourable trend in the stock.
De La Rue Plc (LON:DLAR)
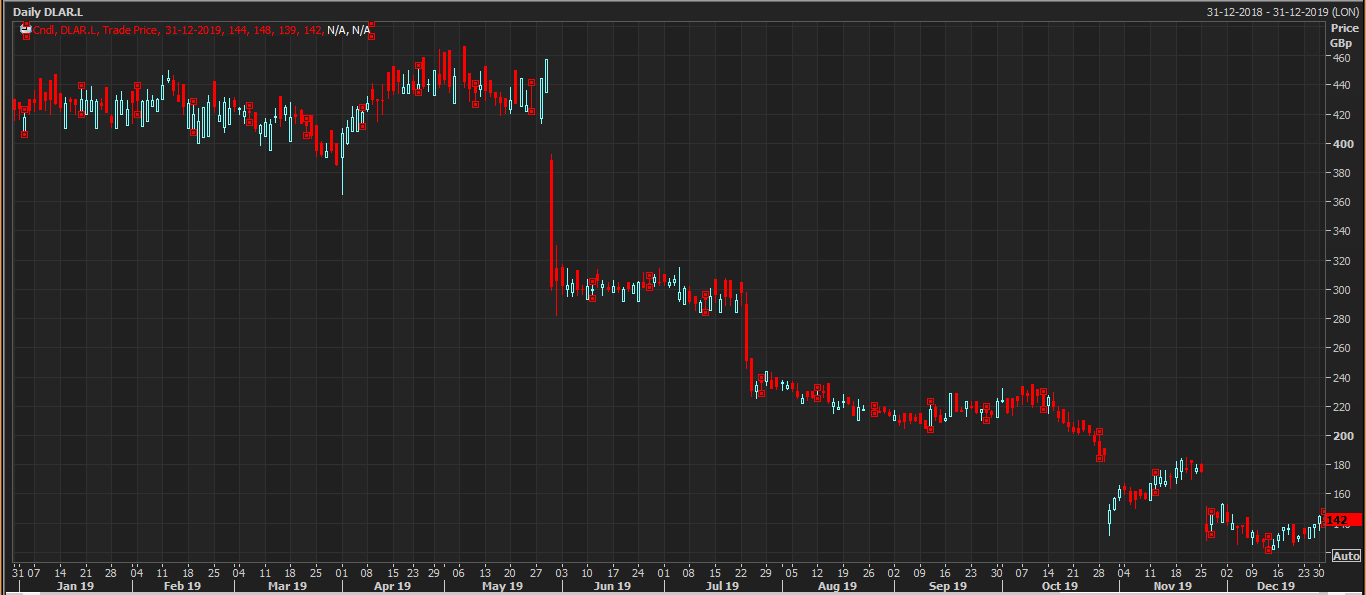
 Daily price chart as on December 31, 2019 (after the market close). Source: Thomson Reuters.
United Kingdome-based De La Rue Plc is engaged in the business of manufacturing, designing, and delivering banknotes to customers around the globe. Its operational divisions include traceability as well as currency and product authentication. The group's market capitalisation stood at £148.04m, which ranks it among the small caps listed on the London Stock Exchange.
In the year-ago period, its share tumbled more than 66.34% which ranks it among the top laggards of the LSE in 2019, also in the past three months, its shares have given up more than 37%, and plummeted around 7% in a month-over period.
From the technical standpoint, its shares ended 2019 approximately 31% below its crucial short-term support level of 50-day SMA and approximately 50% below its long-term support mark of 200-day SMA, reflecting a steep unfavourable trend in the stock.
