


_07_03_2026_03_50_21_133108.jpg)


British American Tobacco PLC
British American Tobacco PLC (BATS) is a leading international consumer goods company which is focused on tobacco and next-generation products, with market-leading position in more than 55 countries. The operations of the group are differentiated in four geographical segments, namely Asia-Pacific and Middle East (APME), United States, Europe and North Africa (ENA), and Americas and Sub-Saharan Africa (AMSSA).
Key Financial Highlights (H1 FY 2019, in £m)
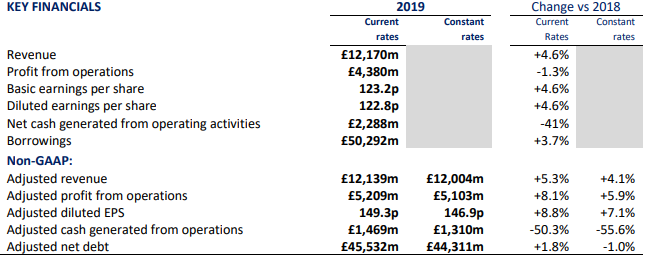
(Source: Company Filings)
Driven by price/mix and growth in New Categories, adjusted revenue grew by 4.1%, while on a reported basis, revenue increased by 4.6% to £12,170 million. Reflecting the continued drive for efficiency improvements (including the product rationalisation to remove complexity), adjusted profit from operations at constant rates of exchange rose by 5.9% to £5,103 million and profit from operations, on a reported basis, declined by 1.3% to £4,380 million. Diluted earnings per share was 4.6% higher to 122.8 pence and basic earnings per share increased by 4.6% to 123.2 pence, while adjusted diluted earnings per share at constant rates of exchange was up by 7.1% to 149.3 pence. As borrowings increased to £50,292 million (30 June 2018: £48,512 million), adjusted net debt rose to £45,532 million (30 June 2018: £44,739 million). Net cash generated from operating activities declined by 41% to £2,288 million and adjusted cash generated from operations reported a decline of 50% or 56% at constant rates to £1,469 million (30 June 2018: £2,953 million).
Dividend
As part of the annual dividend of 203.0p per share announced on 28 February 2019, which is payable in four equal instalments, the third quarter (November) 2019 dividend of 50.75p per share will be paid on 14 November 2019 with the record date of 4 October 2019, marking the third dividend for the year.
Share Price Commentary
On 03 October 2019, at the time of writing the report (at 2:12 pm GMT, before the market close), BATS stock was trading at GBX 2,780.5, down by 4.02 per cent against the previous day closing price. Stock's 52 weeks High and Low is GBX 3,659.00/GBX 2,249.00. The companyâs stock beta was 1.39, reflecting more volatility as compared to the benchmark index. The outstanding market capitalisation was around £66.46 billion, with a dividend yield of 7.01 per cent.
British Land Company PLC
British Land Company PLC (BLND) is a London-headquartered property company which focuses on mixed-use places. The real estate group is engaged in owning, managing, developing and financing a portfolio of commercial properties, focused on retail locations around the country and increasingly multi-use places in London. The operations of the group are differentiated in four operating segments, namely Offices, Retail, Canada Water and Other/unallocated.
Operational Update
For the period since 1 April 2019, high occupancy of 97% was maintained, and headline rents of £7.2 million were generated as retail leasing activity till August 2019 totalled 500,000 square feet. On average, deals were 3% more than ERV, which reflected a 2% premium to previous passing rents, and like-for-like retail sales were up by 1.1% for the quarter ended June 2019.
Financial Highlights (FY 2019, in £m)
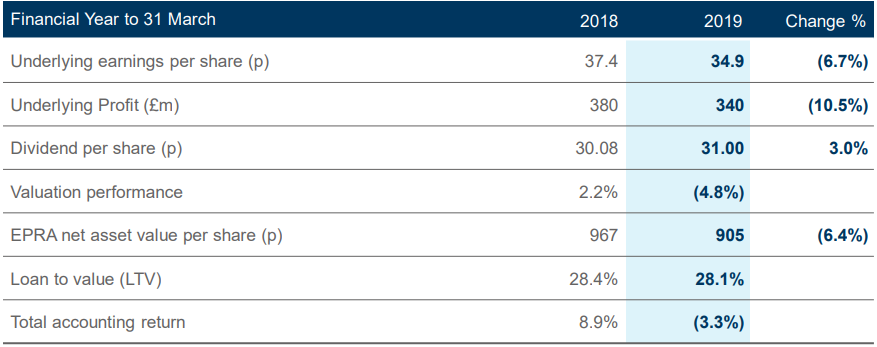
 (Source: Company Filings)
Due to the impact of net divestment over the last two years and one-off surrender premia received in the prior year, net rental income declined by £44 million to £532 million during the financial year ended 31 March 2019. The £14 million impact of Retail CVAs was more than offset by £15 million or 2.4% like-for-like rental growth across the portfolio. Due to change in valuation movement on the properties and decline in capital and other income result from joint ventures, the IFRS loss before tax for the year was £319 million, while underlying profit was down by 10.5% at £340 million, and underlying EPS declined to 34.9p, despite the share buyback completed in the year. Compared to earnings per share of 48.7p per share in the preceding year, IFRS basis loss per share was 30.0p per share. The group recommended a final dividend of 7.75p, bringing the full-year dividend to 31 March 2019 to 31.0p, which was higher by 3% over the last year. Due to a valuation decrease of 4.8% across the portfolio, with Retail down by 11.1%, EPRA net asset value (NAV) per share declined by 6.4% to 995p. IFRS net assets at 31 March 2019 decreased by £817 million over the prior year to £8,689 million while the loan to value reduced by a further 30bps during the period to 28.1%.
Dividend
To shareholders on the register at the close of business on 04 October 2019, the first interim dividend of 7.9825 pence per share will be paid on 08 November 2019, which reflects an increase of 3% on the first interim dividend for the quarter ended 30 June last year.
Share Price Commentary
On 03 October 2019, at the time of writing the report (at 2:14 pm GMT, before the market close), BLND stock was trading at GBX 542.6, down by 3.14 per cent against the previous day closing price. Stock's 52 weeks High and Low is GBX 645.00/GBX 465.30. The companyâs stock beta was 0.92, reflecting less volatility as compared to the benchmark index. The outstanding market capitalisation was around £5.19 billion, with a dividend yield of 5.58 per cent.
Kingfisher PLC
Kingfisher PLC (KGF) is a British international retailing company which offers DIY (do-it-yourself) and home improvement products and services in 10 countries across Europe, Russia and Turkey through over 1,300 stores, under various brands like B&Q and Castorama. The operations of the group are differentiated in four geographical segments, namely UK & Ireland, France, Poland and Other.
Financial Highlights (H1 2020, in £m)
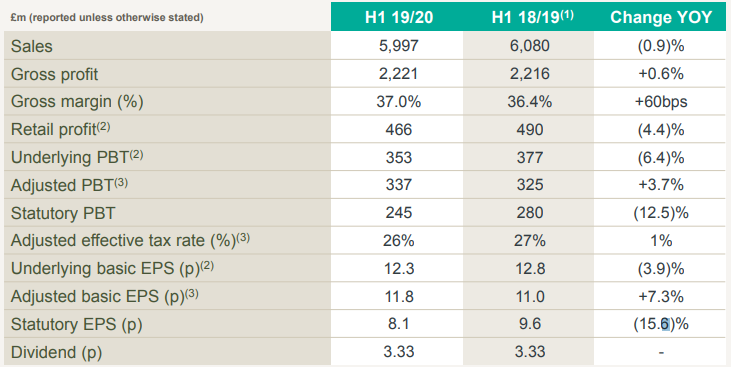
 (Source: Company Filings)
On a reported rate basis, which includes the impact of exchange rates, total sales decreased by 1.4%, while it declined by 0.9%, on a constant currency basis, to £6.0 billion, with like-for-like sales down by 1.8%. Gross profit remained almost flat at £2,221 million from £2,216 million in H1 2019, while the move to everyday low prices (EDLP) and the sourcing benefits from unified & unique product led to 60 basis points improvement in gross margin. Statutory operating profit decreased to £328 million from £369 million in H1 2019, while including the impact of transformation P&L costs and exceptional items, statutory pre-tax profit declined by 12.5% to £245 million. Excluding the impact of exceptional items, adjusted pre-tax profit increased by 3.7% to £337 million and underlying pre-tax profit, which excludes the impact of exceptional items and transformation P&L costs, decreased by 6.4% to £353 million. Driven largely by a decline in France, retail profit in constant currency decreased by 4.4%, while reported retail profit decreased by 4.8% to £466 million. Basic earnings per share decreased by 15.6% to 8.1p (2018/19: 9.6p), adjusted basic earnings per share increased by 7.3% to 11.8p (2018/19: 11.0p), while underlying basic earnings per share decreased by 3.9% to 12.3p (2018/19: 12.8p). Net debt (post-IFRS 16) at the end of the period was £2,384 million (2018/19: £2,661 million), while the ratio of net debt to EBITDA on a moving annual total basis was 1.8 times as at 31 July 2019 (2018/19: 2.0 times).
Dividend
To shareholders on the register at the close of business on 4 October 2019, the interim dividend of 3.33 pence will be paid on 8 November 2019, which was within the medium-term targeted dividend cover range of 2.0 to 2.5 times and was flat as of last year (2018/19: 3.33p).
Share Price Commentary
On 03 October 2019, at the time of writing the report (at 2:16 pm GMT, before the market closed), KGF stock was trading at GBX 187, down by 4.56 per cent against the previous day closing price. Stock's 52 weeks High and Low is GBX 268.20/GBX 186.15. The companyâs stock beta was 0.90, reflecting less volatility as compared to the benchmark index. The outstanding market capitalisation was around £4.14 billion, with a dividend yield of 5.52 per cent.
Rightmove PLC
Rightmove PLC (RMV) is a property portal and largest property marketplace in the United Kingdom, which provides online property search to primarily estate agents, lettings agents, and new homes developers. By offering products and services to property advertisers seeking to reach the audience of UK home movers, the company focuses on organic growth within the UK property advertising market. The operations of the group are differentiated in two operating segments, namely Agency and New Homes.
Financial Highlights (H1 2019, in £m)
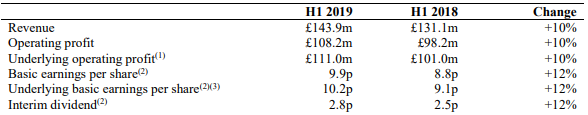
 (Source: Company Filings)
Driven by continued growth in the Agency and New Homes businesses, which were helped by continued spending on additional advertising products and packages, revenue grew by 10% to £143.9 million (2018: £131.1 million). Even as underlying operating costs increased by £2.8 million to £32.9 million (2018: £30.1 million), underlying operating profit increased by 10% to £111.0 million (2018: £101.0 million), while statutory operating profit rose by 10% to £108.2 million (2018: £98.2 million). Reflecting the benefit of companyâs ongoing share buyback programme together with growth in profits, basic earnings per share rose by 12% to 9.9p (2018: 8.8p) and underlying basic earnings per share increased by 12% to 10.2p (2018: 9.1p). The closing cash and money market deposit balance was £54.1 million (2018: £28.1 million), and cash generated from operating activities rose by £11.0 million to £107.7 million (2018: £96.7 million).
Dividend
To shareholders on the register at the close of business on 4 October 2019, interim dividend of 2.8 pence per ordinary share will be paid on 1 November 2019. The dividend reflected the growth in underlying earnings per share and increased by 12% over 2.5 pence paid last year.
Share Price Commentary
On 03 October 2019, at the time of writing the report (at 2:18 pm GMT, before the market closed), RMV stock was trading at GBX 530.8, down by 1.41 per cent against the previous day closing price. Stock's 52 weeks High and Low is GBX 588.10/GBX 415.20. The companyâs stock beta was 0.81, reflecting less volatility as compared to the benchmark index. The outstanding market capitalisation was around £4.76 billion, with a dividend yield of 1.26 per cent.
Â
Comparative share price chart of BATS, BLND, KGF and RMV

 (Source: Thomson Reuters)
