

Growing mobile device use, lower costs, and demand for easy expense claims fuel the travel and expense management software market growth.
WILMINGTON, DE, UNITED STATES, June 18, 2025 /EINPresswire.com/ -- The growth of the global travel and expense management software market is driven by increase in adoption of mobile devices, decline in operational expenses, and rise in need for hassle-free claim of expenses. However, lack of skilled workforce factor hampers the market growth. Contrarily, expansion of the of travel technology companies is expected to provide lucrative opportunities for the market growth during the forecast period.
Request Sample Report (Get Full Insights in PDF - 414 Pages) at: https://www.alliedmarketresearch.com/request-sample/3905
The documentation and processing of organizational business costs for tax deduction, budget compliance, business intelligence, and employee experience management is stated as travel and expense (T&E) management. Travel and expense management software assist users to capture and upload receipts digitally. In addition, the technology helps in automated policy checks by flagging expenses that violate company policies, ensuring adherence to spending guidelines and compliance.
Furthermore, the software integrates with travel booking platforms to centralize travel reservations and itineraries. In addition, the software helps employees plan and book trips within the company's travel policies. Moreover, the software enforces a structured approval process, allowing managers to review and approve expenses before reimbursement.
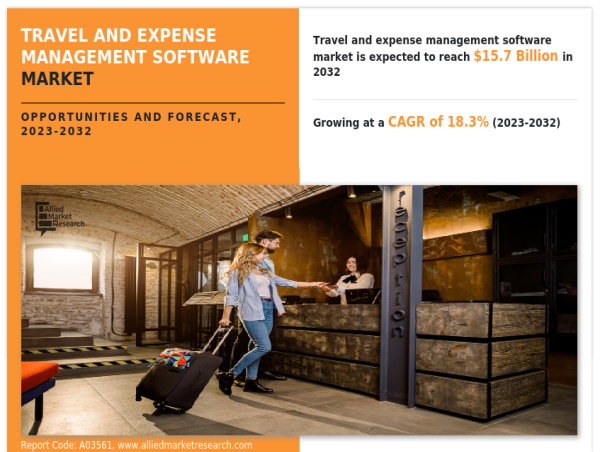
According to the report, the global travel and expense management software market generated $3 billion in 2022, and is anticipated to generate $15.7 billion by 2032, registering a CAGR of 18.3% from 2022 to 2032.
Strategic Developments Driving Growth in the Travel and Expense Management Software Market:
Major players in the travel and expense management software market have adopted various strategies to boost competitiveness and enhance customer service offerings.
In April 2023, Yokoy launched a VISA credit card for business users and the Smart Lodge card, enabling fully-automated business travel payments and expense processing. The solution streamlines VAT validation, reclaim, expense approvals, and reporting.
In December 2021, TripActions introduced TripActions Liquid™ in Europe, a fintech-powered platform supporting card issuance in multiple currencies. This move expands its global reach and automates the entire expense management process.
Buy Now & Get Exclusive Report at: https://www.alliedmarketresearch.com/travel-and-expense-management-software-market/purchase-options
In June 2021, SAP SE upgraded its SAP Concur software with a new AI-powered feature called Verify, which automates expense report approval while flagging anomalies for audit review.
In November 2023, 8Common Limited signed a contract with the Australian Government under the GovERP platform to provide its Expense8 solution. With over $10.8 million in total contract value and an average revenue of $50 per user, it now services more than 40,000 users across 34 federal entities.
In January 2023, Serko Limited partnered with TakeTwo Travel Solutions to offer Zeno by Serko globally. Zeno includes features like budget optimization, savings alerts, and policy-based trip configurations.
These strategic initiatives are significantly propelling the growth of the travel and expense management software industry, especially within the ICT sector.
On the basis of deployment mode, the on-premise segment held the highest market share in 2022, accounting for more than two-thirds of the global travel and expense management software market revenue and is estimated to maintain its leadership status throughout the forecast period. This is attributed to large number of on-premise travel and expense management software providers available in the market. However, the cloud segment is projected to register the highest CAGR of 20.4% from 2022 to 2032. This is attributed to increase in demand for cloud-based travel and expense management software and gradual expansion of cloud-based software development companies
Depending on organization size, the large enterprises segment held the highest market share in 2022, accounting for two-thirds of share in the global travel and expense management software market and is estimated to maintain its leadership status throughout the forecast period. This is attributed to large travel operations carried out by large enterprises. However, the small & medium enterprises segment is projected to garner the highest CAGR of 20.0% from 2022 to 2032. This is attributed to increase in need to avoid unnecessary expenses incurred by the small & medium enterprises during operations.
If you have any special requirements, Request customization: https://www.alliedmarketresearch.com/request-for-customization/3905
Based on component, the software segment dominated the market in 2022. This is attributed to the large number of travel and expense management software providers available in the market. However, the service segment is expected to grow in the future. This is attributed to the growing demand for skills assessment service and gradually increasing travel and expense management software service providers.
By industry vertical, the IT & telecom segment held the largest share in 2022, thus contributing to nearly one-third of share in the travel and expense management software market. This is attributed to the large use of IT technology in developing the cloud and on-premise software. However, the public sector segment is expected to portray the largest CAGR of 26.4% from 2022 to 2032 and is projected to maintain its lead position during the forecast period. This is attributed to the growing digitalization in the government associations, tourism sectors, judicial and legislative sectors, environmental sectors, welfare sectors, and public works sector.
Region-wise, North America held the highest market share in terms of revenue in 2022, accounting for nearly two-fifths of the global travel and expense management software market revenue. This can be attributed to surge in the adoption of cloud-based technology. However, Asia-Pacific is expected to witness the fastest CAGR of 22.9% from 2022 to 2032, and is likely to dominate the market during the forecast period. This can be attributed to increase in the small, medium, and large technology businesses in the region.
There has been a growing trend toward cloud-based travel and expense management solutions. Cloud deployment offers flexibility, scalability, and accessibility, allowing businesses to manage expenses from anywhere with an internet connection. Furthermore, artificial Intelligence (AI) and automation features are being incorporated to streamline processes further. This includes automated receipt scanning, expense categorization, and policy compliance checks, reducing manual effort and enhancing accuracy. Moreover, there is a growing emphasis on data analytics and reporting capabilities within travel and expense management software. Advanced reporting tools provide insights into spending patterns, helping organizations make data-driven decisions. All these factors are driving travel and expense management software market growth.
For Purchase Enquiry: https://www.alliedmarketresearch.com/purchase-enquiry/3905
Leading Market Players: -
Apptricity Corp.
KDS Inc.(American Express GBT)
Interplx Inc. (Serko Limited)
Expensify Inc.
Coupa Software Inc.
8Common Limited
Oracle Corporation
SAP Concur (SAP SE)
TripActions Inc. (Navan Inc.)
AdviXchange Inc.
The report provides a detailed analysis of these key players of the global travel and expense management software market. These players have adopted different strategies such as new product launches, collaborations, expansion, joint ventures, and agreements to increase their market share and maintain dominant shares in different regions. The report is valuable in highlighting business performance, operating segments, product portfolio, and strategic moves of market players to showcase the competitive scenario.
Other Trending Report:
1. Remote Sensing Software Market Share
2. Data Extraction Market Size
About Us:
Allied Market Research (AMR) is a full-service market research and business-consulting wing of Allied Analytics LLP, based in Portland, Oregon. AMR provides global enterprises as well as medium and small businesses with unmatched quality "Market Research Reports" and "Business Intelligence Solutions." AMR has a targeted view of providing business insights and consulting to assist its clients in making strategic business decisions and achieving sustainable growth in their respective market domains.
AMR launched its user-based online library of reports and company profiles, on Avenue. An e-access library is accessible from any device, anywhere, and at any time for entrepreneurs, stakeholders, researchers, and students at universities. With reports on more than 60,000 niche markets with data comprising 600,000 pages along with company profiles on more than 12,000 firms, Avenue offers access to the entire repository of information through subscriptions. A hassle-free solution to clients’ requirements is complemented with analyst support and customization requests.
Contact:
David Correa
1209 Orange Street,
Corporation Trust Center,
Wilmington, New Castle,
Delaware 19801 USA.
Int'l: +1-503-894-6022
Toll Free: + 1-800-792-5285
UK: +44-845-528-1300
India (Pune): +91-20-66346060
Fax: +1-800-792-5285
[email protected]
David Correa
Allied Market Research
+ 1800-792-5285
email us here
Visit us on social media:
LinkedIn
Facebook
YouTube
X
Legal Disclaimer:
EIN Presswire provides this news content "as is" without warranty of any kind. We do not accept any responsibility or liability for the accuracy, content, images, videos, licenses, completeness, legality, or reliability of the information contained in this article. If you have any complaints or copyright issues related to this article, kindly contact the author above.
![]()
