


Summary
- Two US based bluechip technology stocks are making interesting moves on the price charts.
- Microsoft Corporation (NASDAQ:MSFT) recently made a fresh lifetime high of USD 245.07.
- Microsoft Corporation has broken the major resistance zone at USD 227.50 level on the daily chart and prices are getting major support from the 50-period simple moving average.
- International Business Machines (IBM) is trading in an ascending triangle formation on the daily time frame chart and the stock is approaching towards support zone.
Microsoft Corporation (NASDAQ:MSFT) has witnessed a sharp rally from the low of USD 212.03 on 15 January 2021 and made a new lifetime high of USD 245.07 (as on 03 February 2021), a gain of ~15.50 percent in this short span.
Microsoft Corp. Shoots out of a symmetrical triangle
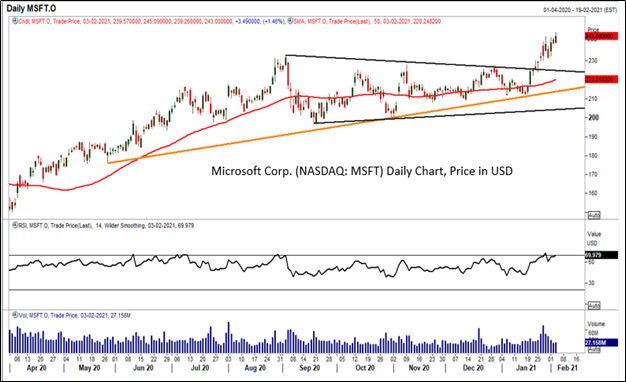
Source: EODHD/Others, Thomson Reuters; Analysis: Kalkine Group
On the daily chart, the stock has broken out of a symmetrical triangle pattern at USD 227.50 level, putting the bulls in the driver seat. If the price sustains above the crucial resistance level the bulls will be dominant and are expected to remain active till the next resistance level of USD 262.50.
Looking at the current chart structure, the stock volumes are showing a strong increasing trend, indicating higher participation from investors. The stock is in a steady uptrend forming higher peaks and higher troughs which, indicates bullish sentiments for the price. Prices are holding the major support of upward sloping trend line (orange line in the above chart) of USD 211.30 level.
Furthermore, the stock is well placed above its 50-period simple moving average (SMA), providing strength to the trend. However, the momentum oscillator RSI (14-period) is trading near the overbought zone at ~70 levels, indicating that a correction from here may drift the price lower towards the support zone.
International Business Machines (NYSE:IBM) consolidation continues
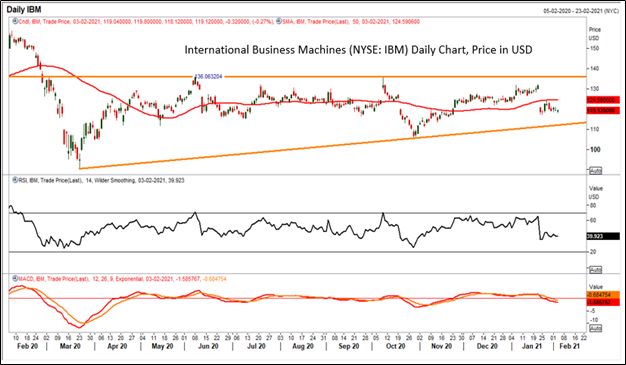
Source: EODHD/Others, Thomson Reuters; Analysis: Kalkine Group
The International Business Machines (NYSE:IBM) shares are trading in an ascending triangle formation for the past few months on the daily chart. Currently, prices have been under pressure and the stock fell by ~11.25 percent in 2 trading sessions, from the high of USD 132.24 (on 21 January 2021) to a low of USD 117.36 level (on 22 January 2021).
Now the stock price is approaching the lower band of ascending triangle, near USD 113.10 level. Moreover, the momentum oscillator RSI (14-period) is trading at ~39.90 levels, indicates that if there is a rebound, then the bulls may push the prices towards the resistance level at USD 130.50.However, the momentum indicator MACD is trading below the centerline, which indicates that if there is a correction, then the bears may remain in the action till the support level of USD 113.10 level. The major support level for the stock is at USD 113.10; any price action with some degree of confirmation below this level might attract bearish sentiments ahead. Currently, the stock is trading below the 50-period SMA, which might act as a crucial resistance zone for the stock.
Conclusion: Based on the above-presented chart analysis and technical outlook, the Microsoft Corporation stock appears to be in a strong uptrend for the past one month, whereas IBM is currently facing the resistance at its 50-period SMA. There might be some action in IBM if prices fall near the support zone or break the crucial resistance zone.
