


Source: Africa Studio, Shutterstock
Summary
- Refined sugar prices have witnessed a 7.71% fall in March 2021.
- Brazilian cane crushing operations are slated to start in April 2021, and it is feared that this might increase the sugar supply in the global markets.
- Sugar production is expected to increase in the top two producing nations Brazil and India. However, production is likely to fall in Thailand due to dry weather conditions.
- Refined prices are showing strength as trading above 21-period simple moving averages (SMA) on a quarterly time frame chart.
- Refined Sugar prices are taking crucial support of an upward sloping trendline at US$398.80 that might provide upside potential for the commodity.
The ICE white sugar number 5 prices have witnessed sharp downside movement by 7.71% to US$ 420 per ton in March 2021 compared to US$ 455.1 per ton in February 2021. Prices had risen sharply in the first two months of 2021 on account of lower sugar production from Thailand and port congestion in top Brazilian port Santos that delayed the global sugar shipments. Consumer countries reportedly rushed to Brazil suppliers as Brazilian sugarcane crushing operations are going to start in April 2021.
White Sugar In A Bowl, Source: © Sss615 | Megapixl.com
Must Read: A lens on the Agri-Commodities; Wheat and Sugar
Recent Price Action Summary of White Refined Sugar
Refined sugar prices are in a primary downward trajectory. Prices traded in a long symmetrical triangle pattern visible on a quarterly chart below and came out above the symmetrical triangle range in the last quarter of 2020. Prices hit the level of $490.1 per ton in the first quarter of 2021. Sugar prices seem to have come out from negative territory as it is trading above the 21-period SMA and providing support to the prices.
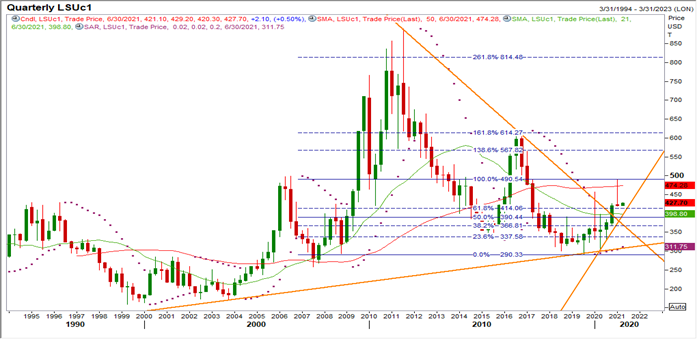
ICE White Sugar No. 5 Commodity Future Continuation 1 (LSUC1) Quarterly Chart (Source: EODHD/Others, Thomson Reuters)
The momentum indicator RSI (14-period) is trading near to ~53 levels which is supportive for the upward direction. The key immediate support level appears to be at US$ 1701 and a break of the same might take the prices down near to 21-period SMA followed by the parabolic SAR support level.
How are leading sugar-producing countries doing in Marketing Year 21 (MY21)?
Brazil: Brazil, the leading sugar producer and exporter in the world, is estimated to produce 42.1 million tonnes of sugar in the crop season 2020-21 as compared to 29.925 million tonnes in the previous season, according to the data published by USDA. The favorable weather has supported the sugar output in the region. Brazilian sugarcane crop is expected to be processed by 48% for making sugar and the remaining 52% for making ethanol compared to last year’s 35% and 65% ratio respectively.
India: India, the second-largest sugar producer in the world after Brazil, is expected to produce 30.2 million tons of sugar in the marketing year 2020-21. Currently, Indian mills have started sugarcane crushing operations in India and 502 sugar mills have started crushing cane in the marketing year 2020-21 compared to 457 mills operated a year earlier. According to the data published by the Indian Sugar Industry Association (ISMA), India produced 25.868 million tons of sugar till 15th March 2021.
Thailand: Thailand is likely to produce 7.9 million tons of sugar in MY 2020-21. Normally, Thailand’s sugarcane crushing operations start in December onwards and last till the end of May every year. However, the dry weather condition in various regions resulted in cane shortage which led to the end of the crushing season by March.
Global Sugar Price Seasonality:
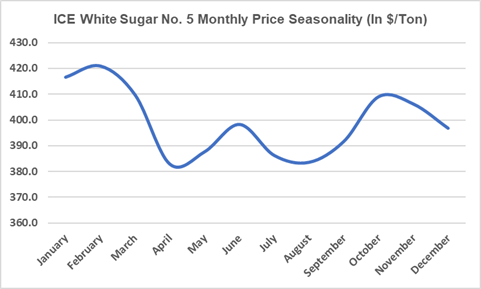
Chart Source: Kalkine Group, Data Source: EODHD/Others Eikon, Thomson Reuters
Refined White Sugar Spot 5-year monthly price seasonality shows that the prices start to increase from April onwards till June from where Brazilian sugar supplies are at their peak. Currently, as cane crushing operations are slowing down in India and Thailand, prices might again find an upside push post April if it follows the above prices seasonality. It can be interpreted from the above chart that current white sugar prices are following a 5-year monthly price seasonality pattern.
Sugar prices seem to have come out from the negative territory. However, rising sugar output from Brazil and India might put pressure on sugar prices in the latter half of the season.
