


Summary
- HSBC Holdings PLC gained 4.18% percent in the last trading session and holding the key support level.
- The stock has broken a rising wedge pattern on the daily chart and getting major support from the 50-period simple moving average (SMA).
- HSBA’s prices are trading in a rising channel formation on the daily chart.
- Prices are moving in a horizontal channel pattern on the weekly chart and taking major support from the Parabolic SAR indicator.
HSBC Holdings PLC (LON: HSBA) has rallied ~21.04 percent from the low of GBX 377.40 made on 02 February 2021 to a new all-time high of GBX 456.80 formed on 08 March 2021. However, post that, the prices are under pressure and formed a low of GBX 412.15 on 22 April 2021, a decline of ~10.84 percent due to profit booking. Despite being in a correction phase, the stock price is trading in a strong upward trajectory, forming a series of higher tops and higher bottoms, which indicates bulls are still in action. On Tuesday, the stock prices closed at GBX 440.40, up by 4.18%, and was one of the top gainers on the FTSE 100 index. The stock outperformed some of its peers, such as Metro Bank PLC. (LON: MTRO) and Scottish Mortgage Investment Trust PLC (LON: SMT).
Daily chart: Prices pierce out of a rising wedge pattern
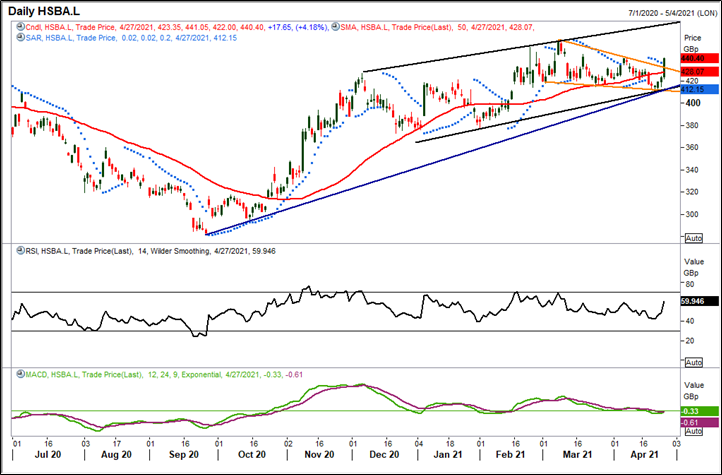
Source: EODHD/Others, Thomson Reuters; Analysis: Kalkine Group
HSBC stock price has broken out of a rising wedge pattern at GBX 431.50 level on 27 April 2021 and closed above the upper band of the wedge pattern. The prices are also trading in a rising channel pattern for the past five months and currently, trading above the lower band of the pattern. The stock prices are sustaining above an upward sloping trendline support level of GBX 410.20 (blue color line in the above chart) and continuously taking support of it.
Moreover, the price is trading above its 50-period SMA, acting as a crucial support level below the upper band of the wedge pattern. The momentum oscillator RSI (14-period) is trading at ~59.94 levels, indicating a positive trend for the stock. MACD (Moving Average Convergence Divergence) is also showing a positive crossover and indicates an upside direction for the stock. The Parabolic SAR indicator is below the market prices and acting as immediate support for the stock.
Weekly chart: HSBC continues to consolidate
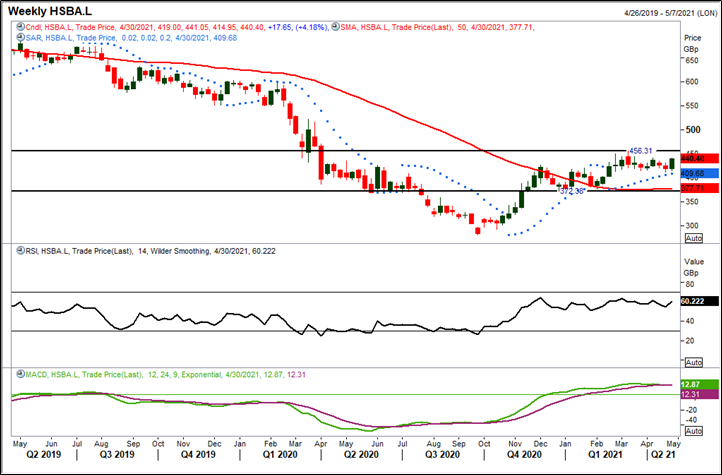
Source: EODHD/Others, Thomson Reuters; Analysis: Kalkine Group
The prices are moving in the rectangle channel formation for the past six months and trading in the range of GBX 372.36 to GBX 456.31 levels. The price is well placed above its 50-period SMA, which is acting as an important support for the stock. Furthermore, the momentum oscillator RSI (14-period) is trading at ~60.22 levels, indicating a possibility of further upside movement in the prices. The prices are trading above the Parabolic SAR indicator, acting as an immediate support zone for the stock. The major resistance level for the stock is at GBX 456.50 level.
Based on the above chart analysis and technical indicators outlook, the HSBC Holdings PLC price seems to be in a strong uptrend. As per the chart analysis, currently, the stock prices are approaching the key resistance zone and there might be more action expected in stock if the price breaks the resistance zone with the higher volumes, as per chart analysis theory.
