


Source: soul_studio, Shutterstock
Summary
- Goldman Sachs Group Inc. (NYSE:GS) has been on an upward trajectory since October 2020.
- The price has broken crucial resistance level and hit an all-time high.
- Stock prices are trading above an upward sloping trend line on the daily chart and getting support from the 50-period SMA.
- GS prices are trading in a steep rising channel formation on the weekly chart; however, the RSI (14-period) is trading near the overbought zone.
Goldman Sachs Group Inc. (NYSE:GS) stock price has risen almost ~31.86 percent from its low of USD 270.62 tested on 29 January 2021, to a new all-time high of USD 356.85 levels made on 18 March 2021. Thereafter the stock has witnessed profit booking and formed a low of USD 317.72 on 29 March 2021. On Wednesday, the stock prices closed at USD 338.55, up by 0.95%,. The stock outperformed some of its competitors, such as Bank of America Corp. (NYSE:BAC) down by 2.86%, Deutsche Bank AG (NYSE:DB) down1.88% and Citigroup Inc. (NYSE:C) was lower by 0.51%.
GS on a daily chart
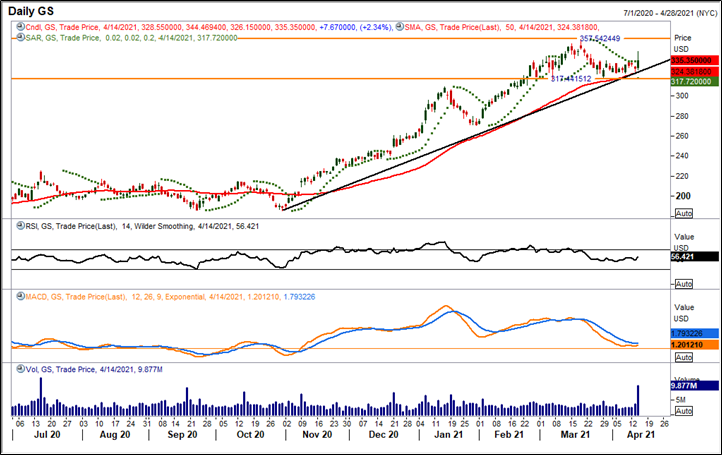
Source: EODHD/Others, Thomson Reuters; Analysis: Kalkine Group
The prices are moving in the horizontal channel formation for the past three months and trading in the range of USD 317.44 -USD 357.54. The stock is trading in a strong upward trajectory, forming series of higher highs and higher lows, which indicates bulls are still in action. The prices are trading above an upward sloping trendline support level of USD 323.40 (black color line in the above chart) and trading upside from that level. Participation in the rally has been good, thee volume has shown a sharp upward trend in the last few trading sessions.
Furthermore, the price is trading above its 50-period SMA, acting as a crucial support zone around the lower band of the channel pattern. The momentum oscillator RSI (14-period) is trading at ~56.42 levels, indicating a positive trend for the stock. MACD is also showing a positive sign and trading above the centerline, depicting odds are in favor of bulls. The price is trading above its Parabolic SAR indicator, acting as a support zone.
GS on a weekly chart
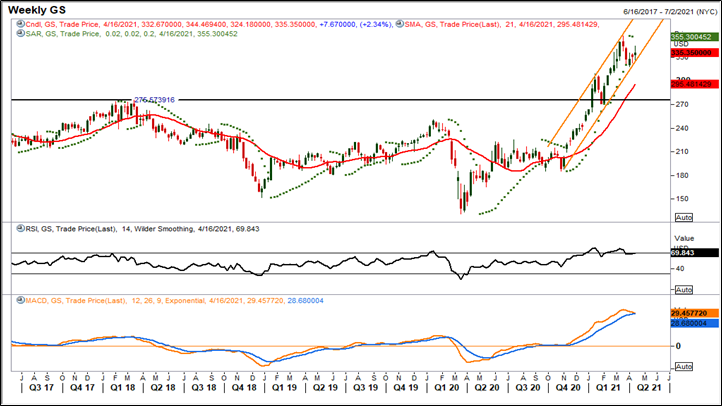
Source: EODHD/Others, Thomson Reuters; Analysis: Kalkine Group
The stock prices are trading in a steep rising channel formation for the past six months and currently, sustaining around the lower band of the channel pattern. The stock has witnessed a breakout of its horizontal trendline (black color horizontal line in the above chart) at USD 275.57 level on 06 January 2021 and post that it hit a new lifetime high.
The stock price is well placed above its 21-period SMA, acting as the important support at the lower end. However, the momentum oscillator RSI (14-period) is trading near to the overbought zone at ~69.84 levels, indicating a possibility of a correction in the prices that might drift the stock lower towards the support zone. The prices are trading below the Parabolic SAR indicator, acting as an immediate resistance zone for the stock. The major resistance level for the stock is at USD 357.54 level.
Based on the above chart analysis and technical outlook, the Goldman Sachs Group Inc. price seems to be in an uptrend. Currently, the stock prices are holding the key support levels. As per the chart pattern analysis, that there might be more action expected in GS if the price breaks the important support or resistance levels.
