
 AUS
AUS
 NZ
NZ
 UK
UK
 CA
CA
 USA
USA
 IND
IND








Source: Song_about_summer, Shutterstock
Summary
- Alfa Financial Software Holdings PLC’s (LON:ALFA) prices are consolidating around a 52-week high for the past six months.
- Before entering the consolidation phase, the prices of ALFA witnessed a robust rally of ~142.33 percent in 4 months.
- ALFA’s Prices are trading in a rectangle channel pattern.
- On the weekly time frame chart, the MACD line is trading above the centerline and a negative crossover with the signal line.
Alfa Financial Software Holdings PLC (LON:ALFA) is a developer of Alfa Systems. It is a technology platform for the asset finance industry. For the past 6 months, the prices of AFLA are consolidating around a 52-week high of GBX 150.49 with a positive bias. Before entering the consolidation phase, prices witnessed a robust rally of ~142.33 percent in 4 months, from the low of GBX 62.10 made on July 06, 2020, to a new 52-week high of GBX 150.49 tested on October 05, 2020. The stock price rallied on Tuesday and closed at GBX 140.50, up by 8.1 percent, and outperforming some of its peers such as NCC Group PLC. (LON:NCC) up 7.20 percent, and Equiniti Group PLC (LON:EQN) up 3.70 percent.
Let us now analyze Alfa Financial Software Holdings for a short-term outlook:
On a weekly time frame chart, ALFA's prices are consolidating for the past 6 months and trading in a range of GBX 120.00 to GBX 150.49. Prices are trading in a rectangle channel pattern and as per the pattern characteristics, a breakout on either side will provide cues about the short-term trend for the stock. Prices are continuously taking support of 21-period SMA for the past four months, indicating an upside direction for the stock. Volume is consolidating with the price action and at an indecisive stage to indicate future direction. On the lower side, levels of GBX 120 is acting as the major support level for the stock.


What are the Technical Indicators suggesting?
The leading indicator RSI (14-period) is trading at ~64 levels and consolidating around the overbought zone, giving a positive stance for stock. Prices are continuously taking support of the trend-following indicator 21-period SMA and formed a positive crossover with another trend-following indicator 50-period SMA. MACD line is trading above the centerline indicating a positive direction, however, forming a negative crossover with the signal line. The summary of technical indicators is as below:
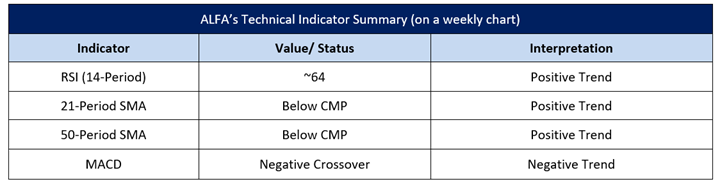
After analysing the current price action coupled with the technical indicators, Alfa Financial Software Holdings PLC seems to be in a consolidation phase and trading at crucial levels. An upside move from the current level may end the consolidation phase of the stock as the prices are getting support from several technical indicators except for MACD, however, a downside move below the major support level might bring the bears into action.
